
Prompted by a post on LinkedIn (Nov 16, 2026) which is difficult for me to understand quickly, I queried Claude
The attached chart is quite complex, and I’d like Claude to provide a simple explanation, given the LinkedIn text (attached two screenshots) and the two linked articles: the first linked article is Without rapid action, the world is heading to irrecoverable overshoot. The second is THE SECRETARY-GENERAL – REMARKS TO PRESS CONFERENCE. Can you access them?
Following is Claude’s explanation:
The world’s climate outlook has barely improved in five years. That is the main message of the Climate Action Tracker (CAT) update published on 12 November 2026, during the COP31 climate summit in Antalya, Türkiye.
With the policies governments have in place today, the world is on track for about 2.7°C of warming by 2100. Even if every promise were kept, including net zero targets, warming would end up close to 2°C. The 1.5°C limit in the Paris Agreement will be passed. What remains open is by how much, and for how long.
The chart below shows all of this, but it is dense. This post explains how to read it.
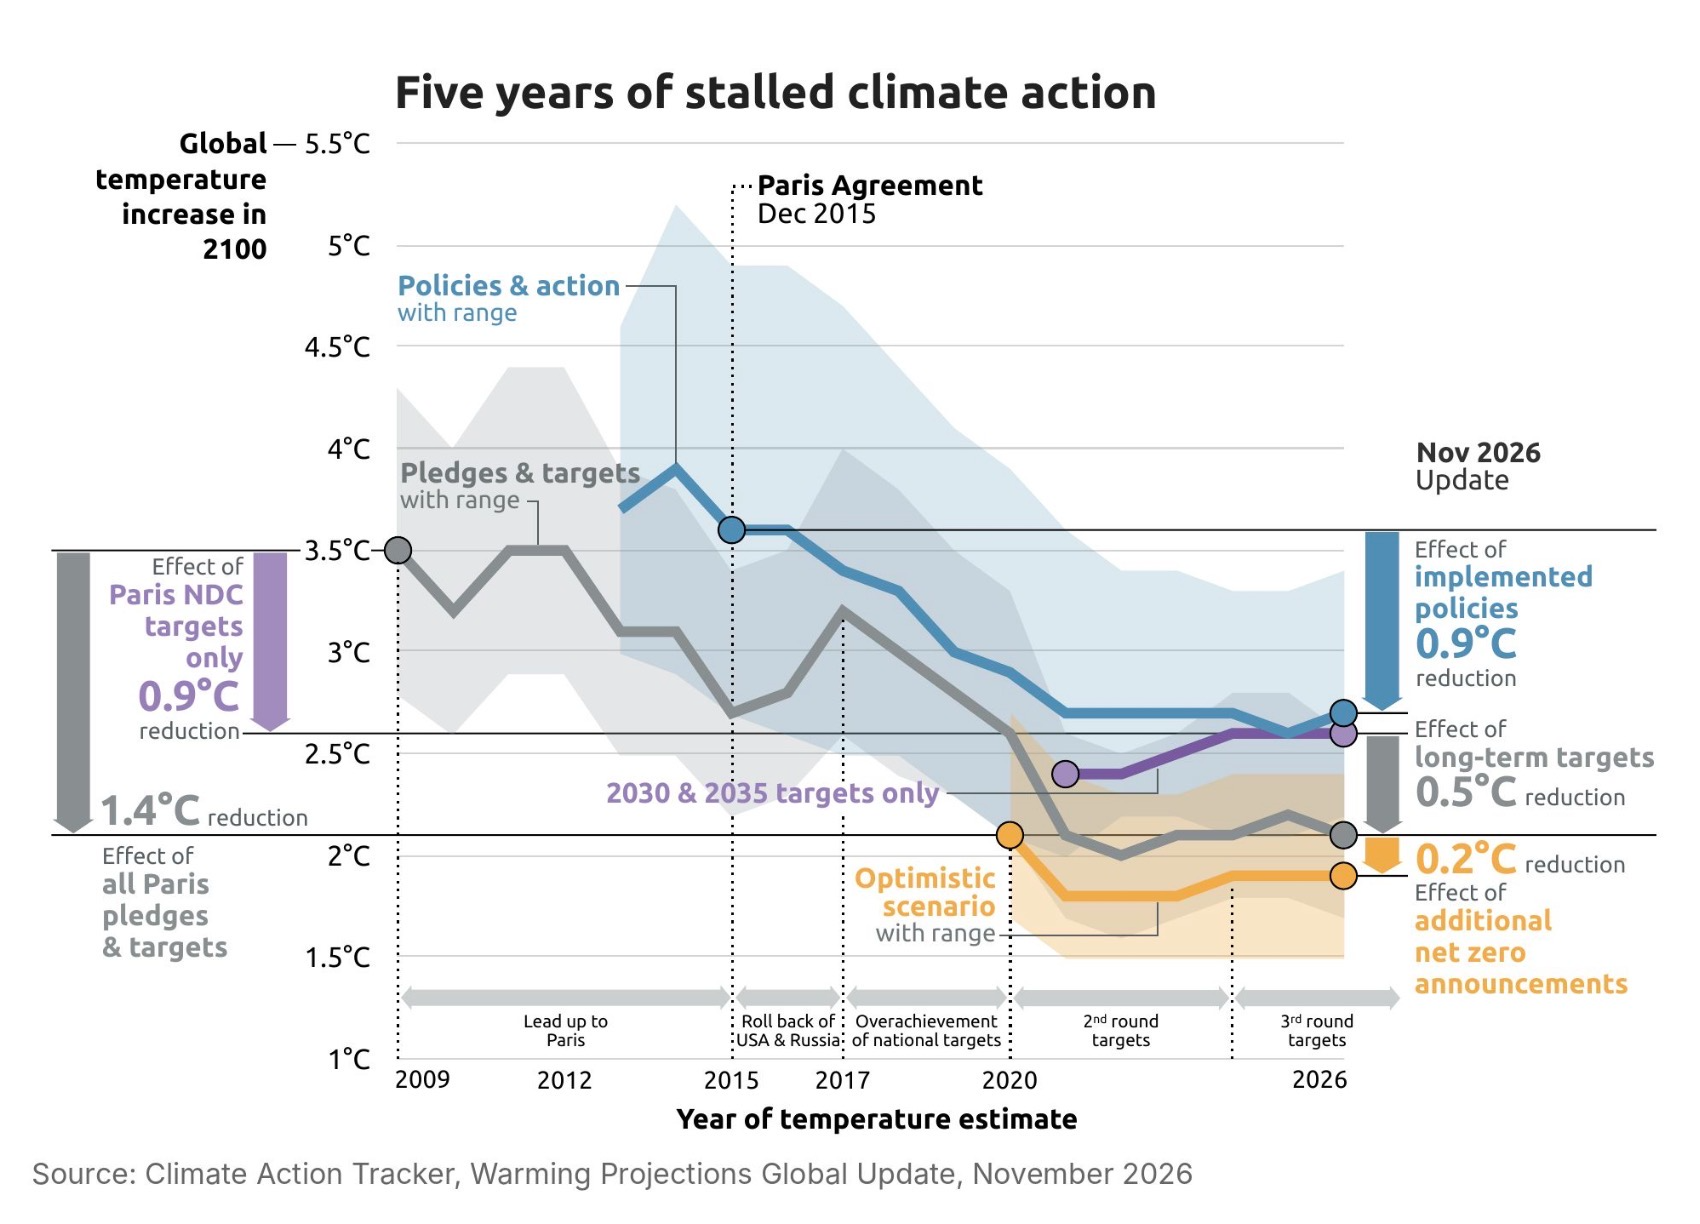
Source: Climate Action Tracker, Warming Projections Global Update, November 2026.
How to read the chart
Each line is a forecast that has been updated every year since 2009. A falling line means the outlook got better; a flat line means it stopped improving.
- Up the side (vertical axis): how much warmer the world is expected to be in 2100.
- Along the bottom (horizontal axis): the year the forecast was made. This is not the year the warming happens.
- The baseline: all temperatures are warming above pre-industrial levels (the late 1800s), not above today. The world is already about 1.3°C warmer than then. So “2.7°C” means roughly another 1.4°C on top of what we already have.
- The shaded bands: the uncertainty range around each line. The thick line is CAT’s central estimate; the real outcome could fall anywhere within the band.
- The grey arrows along the bottom: periods in climate policy, such as the run-up to Paris, the US and Russia rolling back policies, and the second and third rounds of national targets.
The blue and grey lines fell steadily until about 2021 (the purple and orange lines only start around 2020). Since then they have been almost flat. That is the “five years of stalled climate action” in the title.
The four scenarios
The lines run from “what is actually happening” down to “if every promise is kept”. Figures are CAT’s central estimates for warming in 2100.
| Line on chart | What it assumes | Warming by 2100 | Change since 2025 |
|---|---|---|---|
| Blue: Policies & action | Only the policies governments have actually put in place | 2.7°C | Worse (was 2.6°C) |
| Purple: 2030 & 2035 targets only | Countries also meet their official near-term targets | 2.6°C | No change |
| Grey: Pledges & targets | Countries also meet their long-term targets, including net zero | 2.1°C | Better (was 2.2°C) |
| Orange: Optimistic scenario | Every target and net zero announcement is met in full | 1.9°C | Not reported |
Two things stand out. The near-term targets (purple) barely beat current policy (blue), so most of the hoped-for improvement depends on promises for decades ahead. And even the most optimistic line stays well above 1.5°C.
What the arrows on the sides mean
The arrows measure how much each layer of action or promises has lowered the forecast. Each is measured between two specific lines, so they should not simply be added up.
Left side: progress since 2009 (measured on the pledges)
- 1.4°C (grey): the pledges-and-targets forecast fell from 3.5°C in 2009 to 2.1°C today.
- 0.9°C (purple): the part of that drop that comes from the Paris national targets alone (3.5°C down to 2.6°C).
Right side: where today’s gains come from
- 0.9°C (blue): policies actually put in place since the 2015 Paris Agreement lowered the current-policy forecast from 3.6°C to 2.7°C. This is real, delivered progress.
- 0.5°C (grey): what long-term targets would add on top of the 2030 and 2035 targets (2.6°C down to 2.1°C), if they are met.
- 0.2°C (orange): what the extra net zero announcements would add on top of that (2.1°C down to 1.9°C), if they are met.
The lower you go on the right, the more the gains depend on promises rather than action already taken.
Passing 1.5°C: what it means, and what it doesn’t
CAT expects long-term warming to pass 1.5°C around 2030. Without much faster action, it calls this overshoot “irrecoverable”.
That does not mean the outcome is fixed. CAT says the size and length of the overshoot can still be limited, with the aim of bringing warming back below 1.5°C by 2100. Every tenth of a degree avoided still reduces harm.
Getting there would take steep emission cuts: about 4% a year to 2030, about 7% a year in the early 2030s, and about 9% a year from 2035 to 2050. CAT names five main levers:
- phasing out fossil fuels
- cutting methane
- scaling up renewables and electrification
- removing carbon dioxide from the air
- ending deforestation
What the UN Secretary-General said
UN Secretary-General António Guterres drew the same conclusion at a press conference in Antalya on 13 November 2026, at what he called his final COP. In summary:
- 1.5°C: overshooting it is now unavoidable, so the overshoot must be kept as small and short as possible. He put the needed emission cuts at about 6% a year over the next few years.
- Current plans: national plans point to more than 2.5°C of warming by the end of the century, which he called a recipe for catastrophe.
- Fossil fuels: the transition away from them must speed up and be fair and orderly. He also urged confronting the outsized influence of the fossil fuel lobby.
- Finance and justice: rich countries must deliver the climate finance they promised. Those who did least to cause the crisis are suffering most.
He closed with: “Face the facts. Follow the science. Choose the future. And never give up.”
Claude’s take
This section is Claud’s opinion *with which I concur), not a finding of CAT or the UN.
You cannot negotiate with climate change. The physics is simple. Carbon in the air today makes the weather more extreme tomorrow. More extreme weather means slower growth. And the current paradigm is our economies still depend on that growth.
That’s the loop. Until we break it, we can negotiate whatever we like, and the outcome keeps getting worse.
Incremental change, a little more talking, and hoping that “markets” or “innovation” will solve something won’t break that loop. Confronting the power structures that keep us captive to short-term interests might. This will require thinking and acting “outside the box.”
Sources
- Chart: Climate Action Tracker, Warming Projections Global Update, November 2026. Reproduced with credit to Climate Action Tracker.
- Climate Action Tracker: Without rapid action, the world is heading to irrecoverable overshoot (12 November 2026)
- United Nations: Secretary-General’s remarks to press conference (13 November 2026)


