
(the elephant in the room follows Quico Toro’s Substack piece … dessert)
This guy explains clearly the fundamental mistake my recent cartoons attempt to explain in a quick glance … more related posts to follow … hope you get the point that it’s urgent we shift from dogma to real sci real quick. Image previews in the comments …. no words … Quico Toro says it clearly enough
The rounding error climate activists spend all their time fighting over
As long as I can remember, first world climate activists have been organizing politically to get their countries to curb greenhouse gas emissions. The tendency is to treat climate as part of their country’s politics: their issue in the national political conversation. Typically, this manifests as impassioned advocacy for wind and solar energy, which is often what people mean by “climate” in the political arena.
This strategy goes by a pithy, four word slogan: ““decarbonize electricity, electrify everything.” This approach has been so dominant for so long that climate people just don’t question it.
But it’s not a good strategy. For six related reasons:
- Electricity is a small fraction of the energy we use.
- Many energy-intensive activities can’t be electrified.
- Rich countries emit a small and decreasing share of global emissions.
- Energy is only one of the sources of greenhouse gas emissions.
- Greenhouse gases are only one of the ways people change the climate.
- New greenhouse gas flows are a tiny percentage of the stock of greenhouse gases in the atmosphere.
Taken together, this means that even if first world climate activist got everything they’re fighting for, that would barely slow climate change.
To be clear, decarbonizing electric generation where you live is still a good idea, though more on air quality grounds than on climate grounds. As climate strategy, though, it makes no sense.
Let’s see why.
1. Electricity is only about 20% of the energy we use. The rest is direct fuel consumption for transportation, heating, and heavy industry. Some of those things can be electrified, but it’s expensive. We’re currently spending more than $2 trillion a yearon the energy transition, yet just 16% of primary energy use is from low-carbon sources, and most of that is hydropower (now mostly tapped out), nuclear (which greens still refuse to back) and biomass. After spending $11 trillion on them, wind and solar account for 3.3% of primary energy use. Which may make you think we should try to electrify faster, which would be nice, except:
2-Many energy-intensive activities can’t be electrified. The the so-called “hard-to-abate sectors” — cement-making, steel-making and petrochemicals ‚ emit carbon dioxide directly as part of their irreducible chemistry. Cement alone, if it were a country, would vie with India for the spot of third-largest emitter on Earth.
Other sectors are electrifiable in principle, but wildly impractical to electrify in practice. Jet fuel packs forty to fifty times more energy per kilogram than the best lithium-ion batteries, which is why an electric airliner’s batteries would weigh more than the airliner. You can, theoretically, run a container ship on green hydrogen, it’s just that it costs an arm and a leg. Any country or company that tried to mandate these solutions would put itself out of business.
Which is why electricity today covers only about a fifth of final energy use, and even the IEA’s most aggressive net-zero scenario — a scenario nobody really thinks is viable — only gets that to about half by 2050.
So you can’t really electrify everything. But even if you could decarbonize your country’s entire energy sector —which you can’t— it wouldn’t solve the problem because:
3-The places where most climate activists live are not the places where emissions are rising. The countries where climate activists are numerous enough to matter — largely rich Western countries — account for a small and falling share of global emissions. All emissions growth now comes from outside the rich country bubble. For all the talk about Chinese Solar, in 2024 China started construction on roughly a new coal plant’s worth of capacity every week. The entirety of the problem with emissions is about the Global South, where decarbonization has no political traction and renewables exist mostly as a way of sidestepping corrupt/useless utilities.
But even if there was a way to decarbonize energy in the developing world quickly, which there isn’t, that wouldn’t be the end of the story, because:
4-The energy sector is not the whole of the greenhouse gas problem. Agriculture, deforestation, cement chemistry and waste — sources that have nothing to do with how we make energy — account for over a quarter of greenhouse gas emissions: more than all the cars, trucks, ships and planes combined. It is one of the most well-established laws of economic development that as people leave poverty, they demand more animal protein. Other than a vague wish for people to go vegan, the standard first world climate activist approach simply has nothing to say about the non-energy sources of GHGs.
And even if you could end non-energy emissions, which you can’t, it turns out that:
5-Greenhouse gases themselves are only one of the ways human activity is changing the climate: changes in albedo account for a rising share of the warming trend we’re seeing. The specifics are hotly contested, but the world is getting literally darker. We have fewer bright clouds, less arctic ice cover, less cloud cover from maritime “ship tracks,” and also fewer reflective particles from sulfur pollution to offset warming. Altogether, something like a tenth to a fifth of a degree of the warming we’ve seen this decade comes from falling albedo, not from greenhouse gas emissions — record-low albedo alone may account for 0.2°C of 2023’s temperature spike. This appears to be the reason why global warming is accelerating even though greenhouse gas emissions are coming in towards the lower end of the prediction range.
So “decarbonize electricity, electrify everything” is not just wrong, it’s damaging. Because it’s wrong in a particularly insidious kind of way: it lulls people into thinking they’re backing a comprehensive strategy when they’re doing nothing of the sort. You end up with a movement fighting for goals that are at the same time 1-not attainable, and also 2-would not get you where you want to go even if they were attained.
This is why I have so little patience for climate-as-activist-politics.
Devoting your climate activist juices to parochial fights over how your electricity is generated means focusing on a tiny section of one part of one aspect of a much bigger problem —how humanity changes atmospheric chemistry— which itself is not the whole of the problem of human impacts on climate.
America’s electricity sector emits about 1.7 billion tonnes of CO₂ a year, against roughly 55 billion tonnes of global greenhouse emissions. So the stuff that makes up the vast bulk of activist climate energy in the U.S. is a fight over roughly 3% of the global drivers of climate change. For EU activists, the figure is about 1%. For Japanese activists, a bit under 1%. For British activists, a pathetic 0.06% — the UK’s entire power sector now emits less in a year than China’s does in three days.
First world climate activists could win every single one of the fights they’re in, and they’d have solved 5% of the problem. A political program that has nothing to say about 95% of the problem it sets out to address is not a political program that deserves respect.
And even that 5% is charitable, because:
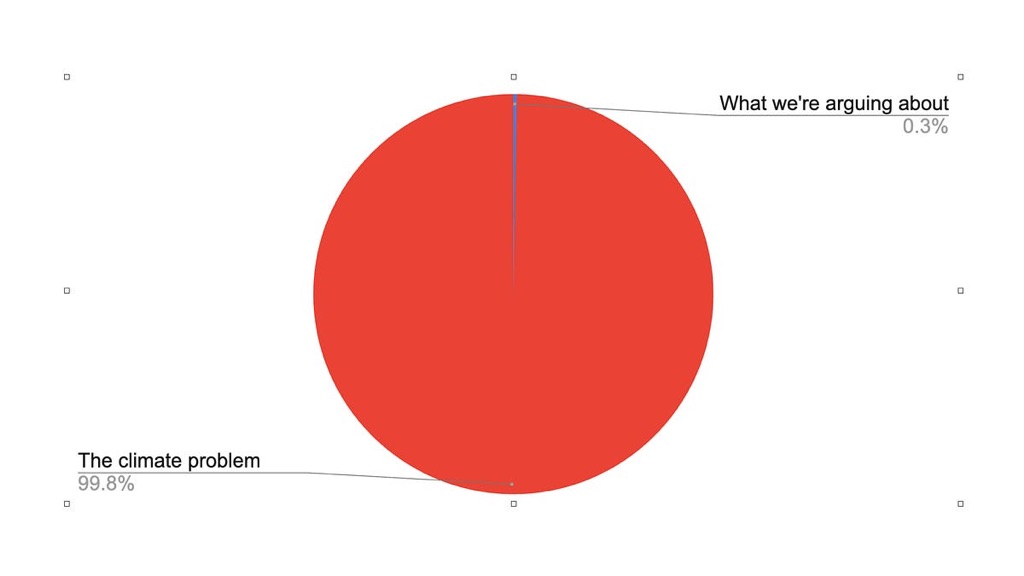
6-Focusing on emission flows ignores the stock of anthropogenic CO₂ that’s already built up in the atmosphere. This is an issue mainstream climate activism refuses to discuss, in part because it has no idea what to do about it. Think in stocks rather than flows and first world climate activism collapses to a rounding error: humanity has emitted some 2,500 GTs of CO₂ since 1750, of which about 1,150 GTs are still sitting in the atmosphere.
More than half of that total went up after 1990 — we have emitted more CO₂ since the IPCC’s first report than in all of human history before it. The not-quite 3 GTs a year of first world electricity emissions that take up first world climate activist mindspace to the exclusion of all else are one quarter of one percent of the accumulated problem.
There’s a failure to register the actual scale of the problem here that drives me around the bend. In graphic form, it looks like this:
A movement that can’t even wholeheartedly back the best technology we have for dispatchable zero-carbon electricity —nuclear— isn’t a serious movement. A movement uninterested in developing affordable ways to remove greenhouse gas from the atmosphere doesn’t deserve the monopoly it has on climate discourse. A movement that won’t even discuss the loss of albedo forefeits the right to decree what is and is not sayable about the climate.
The climate movement today, the movement that sets policy for the Democratic Party in the U.S. and the Labour Party in Britain, the movement that drives the UNFCCC’s discussions and the climate desks at legacy media outlets, isn’t serious about climate.
__________________________________________________________________________________
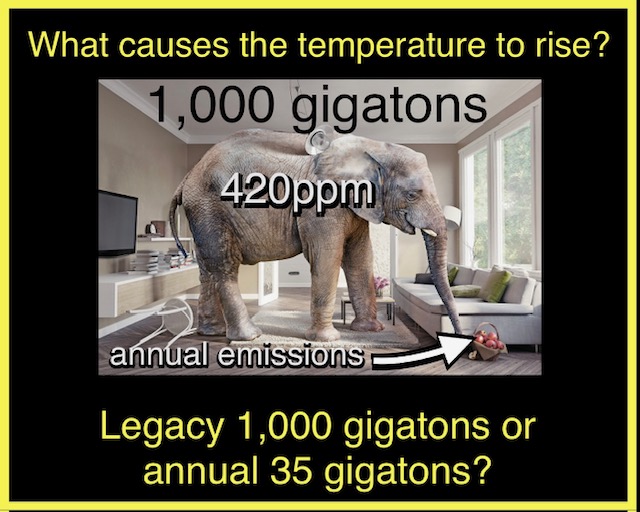
My visual “creative art” created a few years ago illustrates the magnitude of the difference between atmospheric CO2 concentration (elephant) vs. annual global CO2 emissions (basket of apples)
__________________________________________________________________________________
My “graphic” created a few days ago illustrates the magnitude of the difference between a CO2 emissions (bronze curve) —not tonnes, rather ppm equivalent— and Keeling Curve CO2 atmospheric concentration (green curve) both of which are rising at an accelerating rate vs. the apparent decoupled annual global CO2 emissions (red curve) which appear to have stabilized in the past few years.
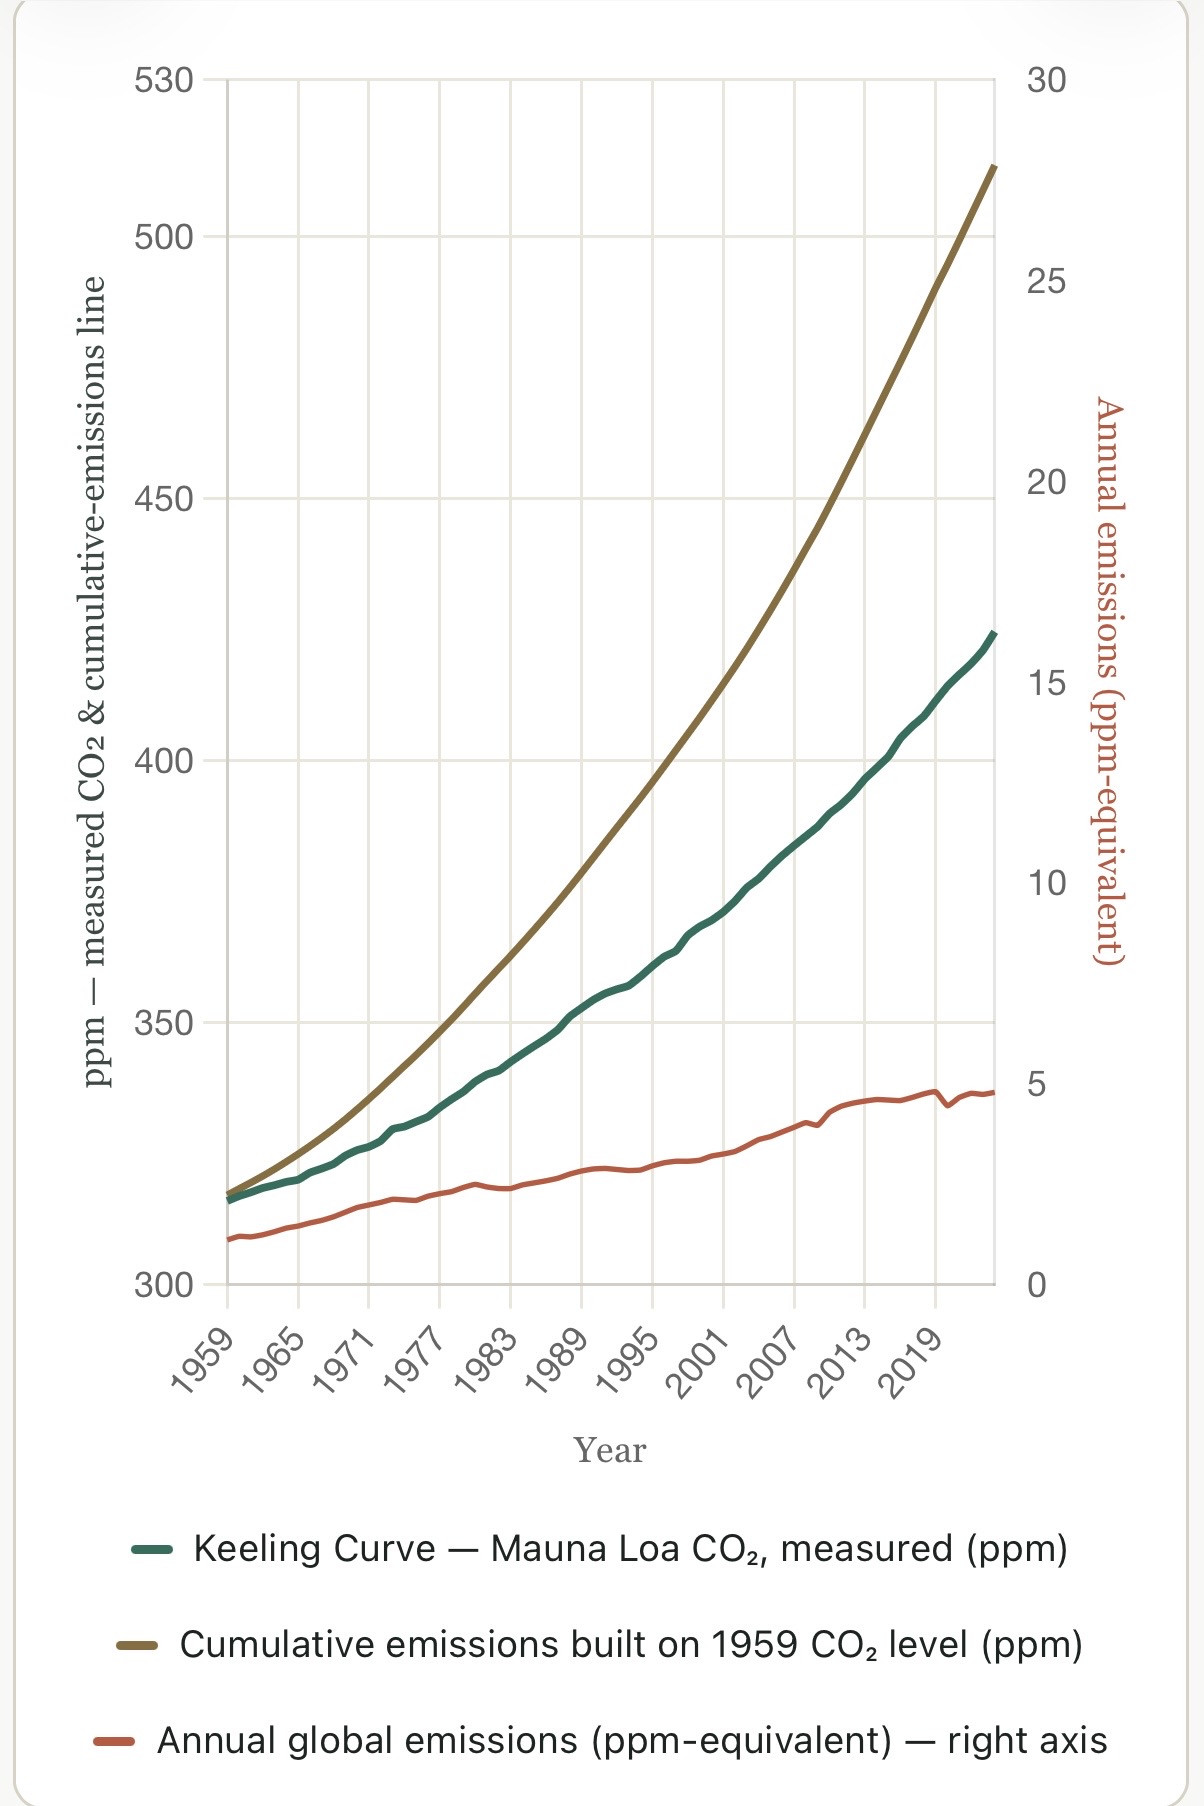
| This set of curves was generated by Claude AI based on my vision and iterative instructions, correcting Claude’s non-human inability to visualize what I described in text, until the result was simple and clear enough for the layperson and scientist or policy-maker to quickly grasp the predicament we face: HOW QUICKLY CAN WE POSSIBLY TURN THE TRAJECTORY INTO A COOLING TREND? Global Mean Surface Temperature follows the total CO2 concentration in the atmosphere, hence to bend the warming trend downward into a cooling trend will require reducing the CO2 concentration in the atmosphere as well as in the ocean as the two will equilibrate as CO2 is removed and sequestered in the soil, vegetation or send into the abyss of the ocean as solid organic compounds (e.g., phytoplankton, krill, kelp, whale poop, calcium carbonate, etc.) Claude is very intelligent, and has assisted me organizing my experiences and thoughts as well as articulating complex concepts clearly and concisely. Following is Claud’s explanation of the curves: The Keeling Curve, with emissions stacked on top Two lines, both starting from the same point in 1959: the actual measured CO2 level (green), and a hypothetical line (bronze) built by adding each year’s global emissions on top of that same starting point, as if nothing were ever absorbed. The gap that opens up between them is what’s been sequestered. Annual emissions sit on their own right-hand scale below, so their rising trend stays visible. Reading it: both lines start at 316 ppm in 1959. The bronze line just keeps adding that year’s emissions on top, year after year, as if the atmosphere kept every molecule ever released. The green line is what actually happened. They separate almost immediately and keep widening: by 2024 the bronze line reaches about 514 ppm, while the actual atmosphere measures 425 ppm — a gap of roughly 89 ppm. That gap is the running total of everything land and ocean sinks have pulled back out of the air since 1959. The right-hand axis shows the annual flow behind it: emissions climbing from ~1.1 ppm-equivalent/yr in 1959 to ~4.8 ppm-equivalent/yr in 2024. Sources & method: Mauna Loa annual-mean CO2 is the actual Scripps/NOAA Global Monitoring Laboratory record (1959 is the first complete annual mean; Keeling’s instrumental record began March 1958). Annual global fossil CO2 emissions are approximate figures reconstructed from published Global Carbon Project / Global Carbon Budget benchmarks, interpolated year-to-year through documented turning points (1974 oil shock, early-1980s recession, 1991-93 Soviet collapse, 2009 financial crisis, 2020 pandemic). The bronze line is the 1959 starting ppm (315.98) plus the running sum of that emissions series, converted to ppm using 1 ppm CO2 = 7.81 GtCO2 (2.13 GtC/ppm × 3.664 GtCO/GtC). Land-use-change emissions (deforestation, etc.) are excluded throughout for methodological consistency – including them would push the bronze line, and the sequestration gap, higher still. Emissions figures are illustrative of scale and trend, not precise official annual statistics. |


