The following email arrived in my inbox this morning from a world-class scientist who participates in an international Google Group of scientists, engineers, and other technology and economic professionals.
From: Tom Harris
Subject:[HPAC] Accelerating global warming and the rate question
Date: October 20, 2026 at 9:05:20 AM EDT
To: Healthy Planet Action Coalition (HPAC)
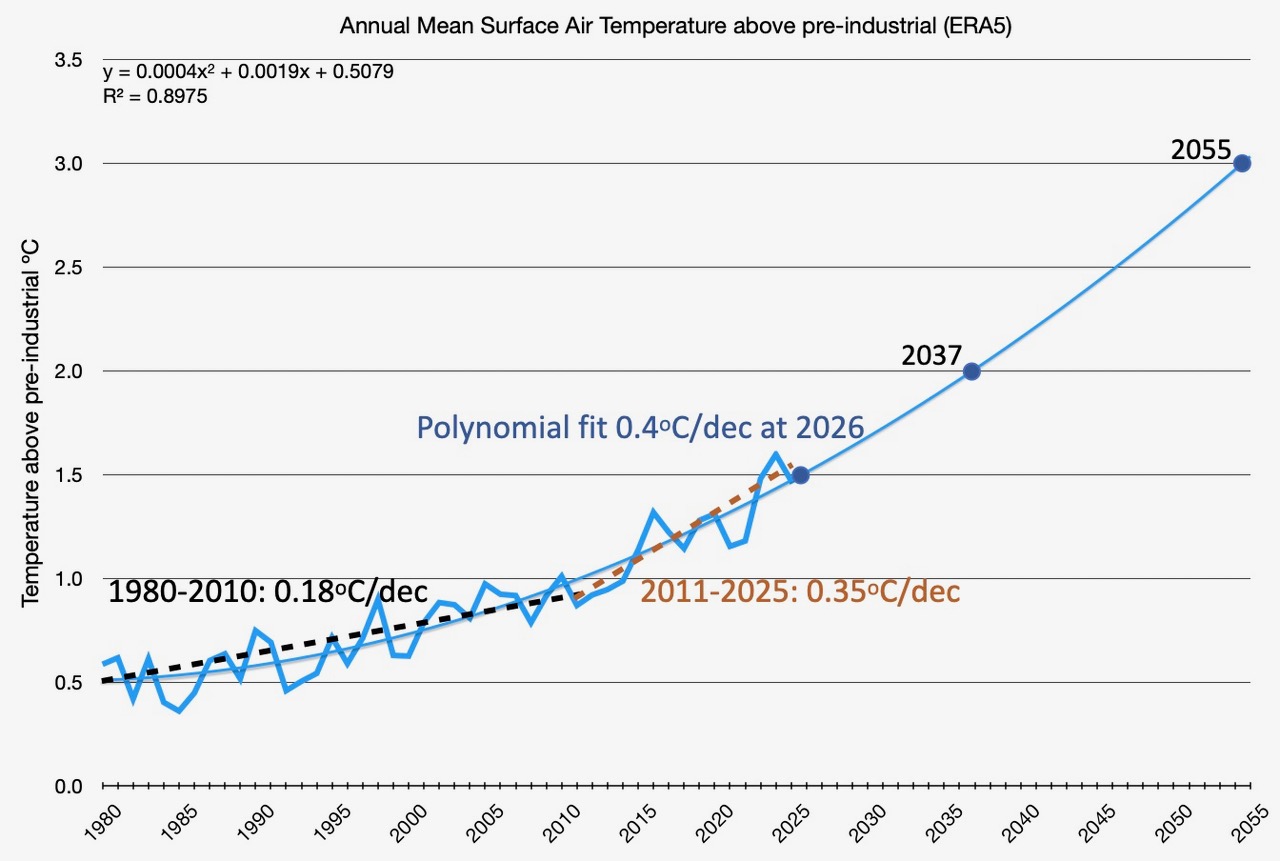
There has been some debate recently on the current rate of global warming, and the fact that it has accelerated. A new paper just published suggested a new rate of 0.4ºC per decade (1). This comes after a paper earlier in the year suggesting 0.35ºC per decade (2). Both are considerably higher than the previous accepted rate since the 1980s of 0.18ºC per decade.
Methods have been challenged and posts written about it, notably from The Climate Brink (3). But I think they miss a fundamental aspect of the process behind the warming. The debate is about finding an inflection point or break from one rate to another. It’s a symptom of looking for decadal averages in an accelerating system, something it seems unique to climate science. Engineering doesn’t do that.
The fundamental driver of global warming is the Earth’s Energy Imbalance (EEI). This is basically the rate of energy accumulation, and therefore heat, in the various systems of the climate. The higher the EEI, the faster the warming, it’s that simple.
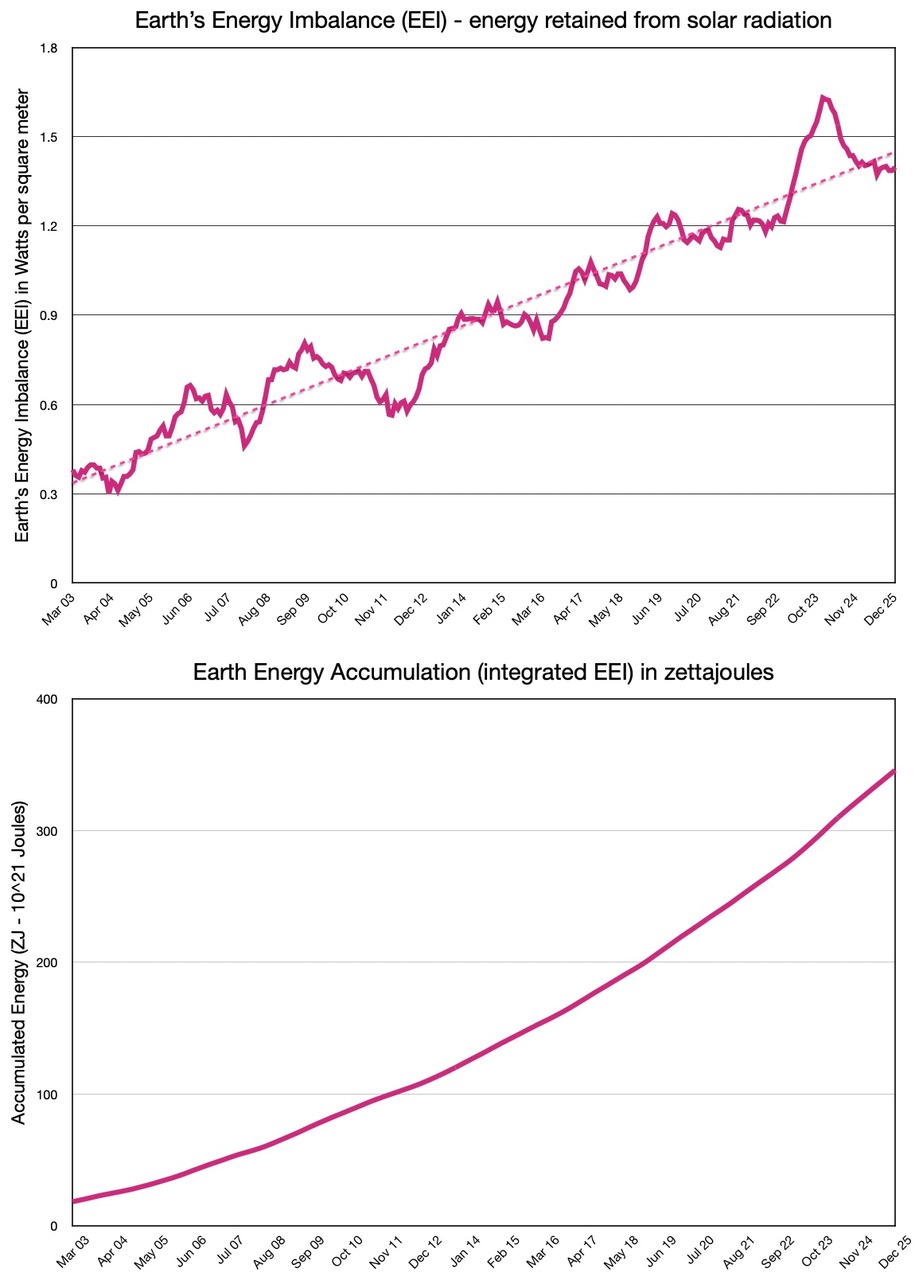
If we look at the EEI for the last 25 years, it shows a remarkably linear rise of a little more than 0.45 W/m2 per decade. That linear rise in rate creates an accelerating energy accumulation which follows a polynomial trend, since its basically integrating the linearly rising EEI.
A polynomial is a curve where each point marks the tangent of the trend it is following. By reading off the tangent values, you can see the rate of change at that point on the curve.
Given that the Earth’s energy accumulation follows a polynomial, it therefore makes sense to use a polynomial fit to the various places where that heat accumulates, such as ocean heat content, surface air temperature etc. It’s no surprise therefore, that the polynomial fit is a better representation of the observation data than linear fits in the observed surface air temperature.
The trend shows the acceleration nicely, not as a jump at some break point, but in a continuous curve fitting the data closely.
So what is the current acceleration in 2026? Well, wouldn’t you know, its 0.4ºC per decade. It was indeed 0.18ºC per decade back in 1999, but the EEI has quadrupled since then.
Following this curve also shows when the various Paris thresholds will be crossed assuming the EEI trend remains constant. 1.5ºC is crossed this year. 2ºC is crossed in 2037, when the rate of warming will have increased to 0.49ºC per decade. Going further forward, 3ºC is crossed in 2055 with a rate of warming at 0.63ºC per decade.
That relies on the EEI trend doing the same thing in the next 30 years as it has in the last 25 years. Much of that comes from changes in albedo driven mainly by cloud-temperature feedbacks, so the chances of a continuation are high. It also comes from the rate of our emissions accumulation. Reducing our emissions therefore, has never been so urgent.