
Part 1 of 2
The October 12 PDF version is difficult for some to read, so this TEXT v.2 is reposted at the suggestion of a reader. I hope this is easier to understand.

Preface – Two “briefings” (Part 1 and Part 2) prepared by Claude AI under my instructions—drawing on four previous queries in May—are quite deep and dense with assumptions, numbers and dates, so I asked Claude to prepare a synopsis and synthesis of the two (this preface is being added to Part 2 as well). Following is what Claude prepared in summary, intended as a letter or email of transmittal to people of influence::
Two climate briefings, in plain English
These are two short briefings on what it would take to stabilize the climate. They are dense, so here is the gist of each and what they mean together.
1. The Road to Net Zero. This briefing asks what happens if the world keeps decarbonizing at a realistic pace. Power plants and cars clean up first. Airplanes, ships, steel and cement come last, so true global “net zero” (no more CO₂ added each year) arrives around 2065–2080, not 2050. CO₂ in the air keeps climbing to about 480 ppm around 2060, compared with 432 today, and then drifts down only slowly. Warming passes 1.5 °C around 2030 and peaks near 2.1 °C around 2070. After that it levels off but does not fall. The transition costs more up front, but lower fuel bills pay it back by about 2070, and the overall economy comes out ahead from the 2040s on. Net zero stops the damage from getting worse. It does not undo the damage already done.
2. Net Zero Plus Carbon Removal. This briefing asks what it would take to go further and actually return the atmosphere to pre-industrial CO₂ levels of about 280–300 ppm. The answer is an industry that pulls CO₂ back out of the air through forests, soils, crushed rock and machines. By 2080 it would have to remove about 85 billion tonnes a year, roughly twice what the whole world emits today. If that were done, warming would peak near 1.9 °C around 2052, drop back below 1.5 °C around 2074, and fall to about 0.8 °C by 2100. The price is about $8 trillion a year, around $215 trillion in total. It only makes economic sense once you count the climate damage it prevents, because removing carbon saves no one any money on fuel. The oceans also push back: as CO₂ is pulled from the air, the seas release some of what they absorbed. Nearly half of every tonne removed is cancelled out this way.
Taken together. The two briefings agree on three hard truths:
- Cutting emissions is necessary but not enough. Even a successful transition leaves us stuck at about 2 °C for centuries.
- The only way back down is to take carbon out. That takes an effort as large as the energy transition itself, built alongside it and not in place of it, and it would have to keep running indefinitely to hold the gains.
- The cost of acting is real, but the cost of not acting is larger. Once avoided climate damage is counted, both paths leave the world economy better off, and the sooner we start, the cheaper it gets.
Think of the first briefing as turning off the tap. The second briefing is about bailing out the bathtub, and the bathtub keeps leaking water back in.
The carbon-removal scenario is best read as an upper bound on what it would take, not a forecast of what will happen. It is several times larger than anything in the IPCC’s pathways, and neither briefing models tipping points such as ice-sheet collapse.
With best regards,
Doug Grandt
Claude added this final editorial which does not require action as the difference noted will probably only be noticed by the most intense reviewer, for which these are not intended:
I noticed one thing worth fixing before you send. Section 3 of the carbon-removal briefing says the net-zero-only path “peaks higher than in the companion briefing: about 482 ppm … rather than 463 ppm.” But 463 ppm is the carbon-removal path’s own peak. The companion briefing’s figure is about 480 ppm, so the two briefings actually agree. The sentence should say that, or be dropped.
The Road to Net Zero
Timeline, costs and benefits, atmospheric CO, global temperature and economic effects
Overview
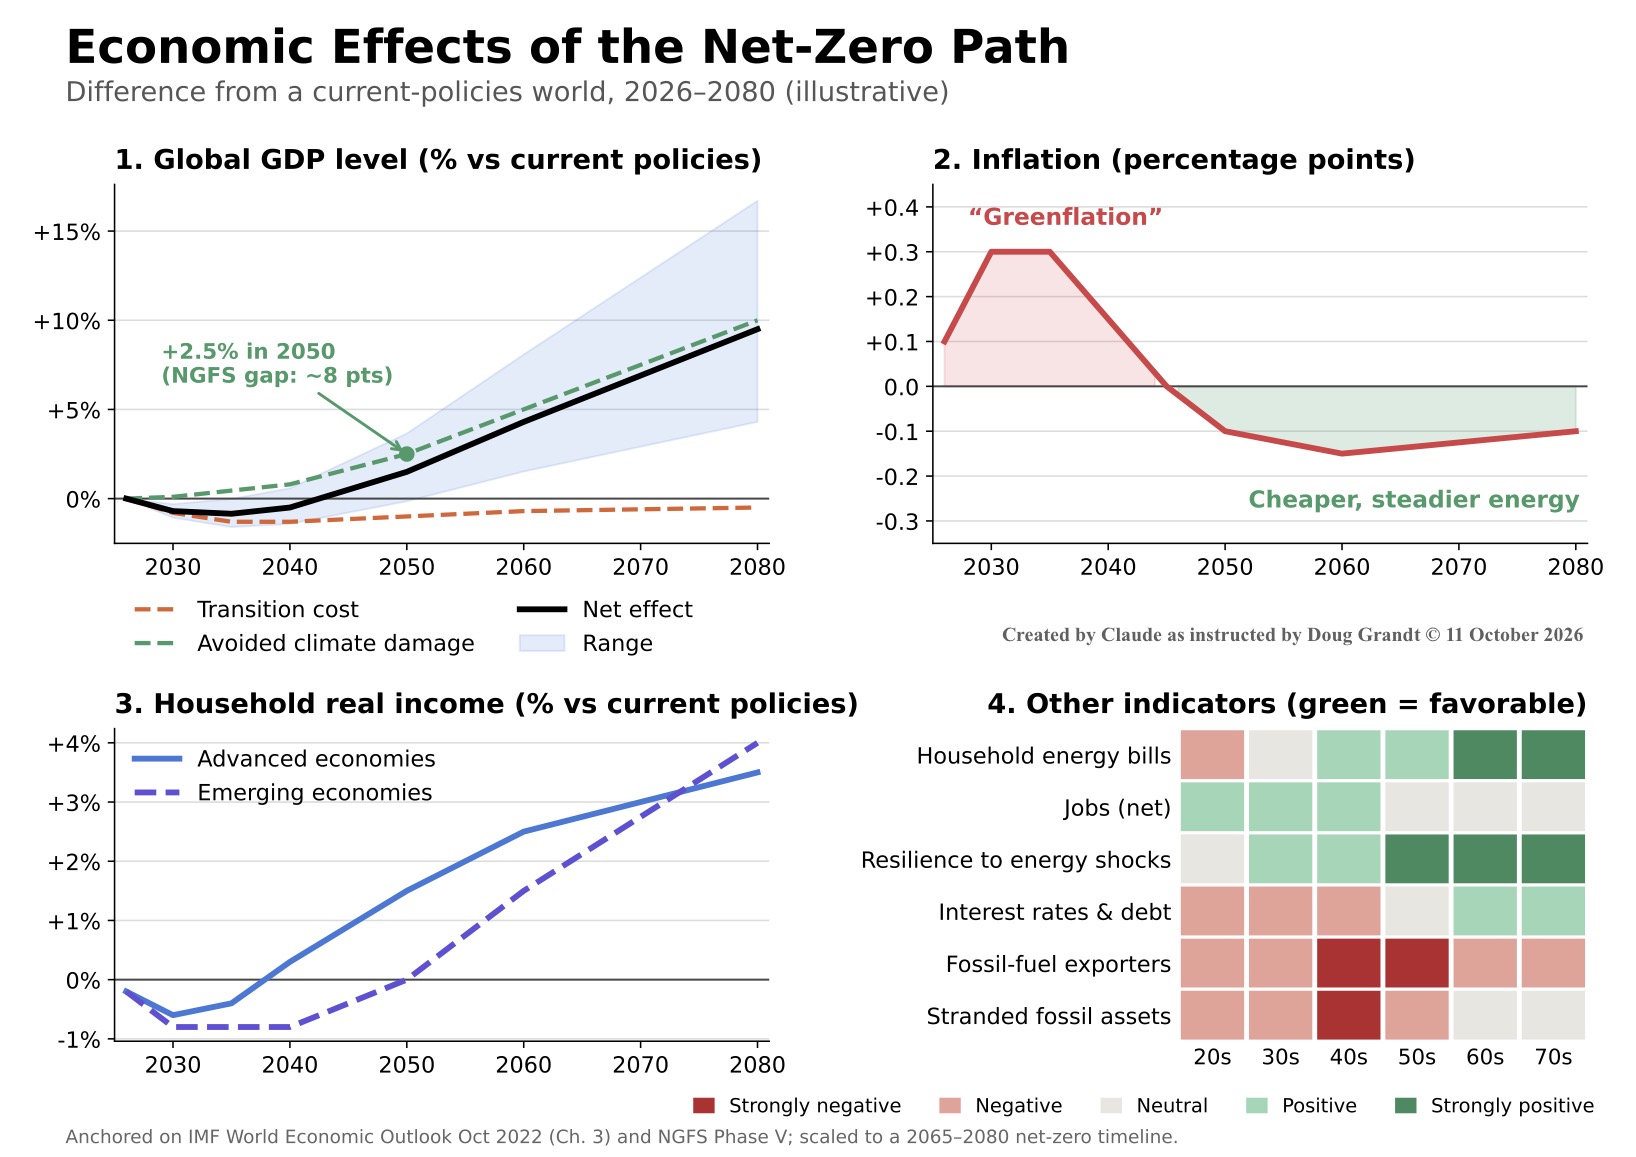
This briefing brings together five linked views of the global energy transition. Figure 1 sets out when key decarbonization milestones are realistically likely to be reached. Figure 2 estimates what the transition costs and saves, year by year and in total. Figure 3 shows how global CO2 emissions could fall to net zero and what that means for the concentration of CO2 in the atmosphere, as tracked by the Keeling curve. Figure 4 translates the CO2 path into global mean surface temperature, including other greenhouse gases, aerosol pollution, Earth-system feedbacks and a moderate carbon-removal option. Figure 5 traces the knock-on effects for GDP, inflation, household income and other economic indicators.
The five views tell a consistent story. The power sector moves first, the hardest sectors move last, and true global net zero lands somewhere around 2065–2080. The transition costs more upfront for two decades or so and then pays back through lower fuel bills. Atmospheric CO2 keeps rising until about the 2050s, peaks well before net zero, and thens lowly declines. The 1.5°C target is almost certainly missed; 2°C remains possible with urgent action. Warming crosses 1.5°C around 2030, peaks near 2.1°C around 2070, and then levels off rather than falling. Economically, the transition is a modest drag in the 2030s and a clear gain from the 2040s onward, with fossil-fuel exporters bearing the heaviest costs .
1. Realistic timeline to net zero
| Milestone Realistic range | |
| Coal power exit (OECD) | 2035–2040 |
| Coal power exit (global) | 2045–2055 |
| EV majority of passenger fleet | 2040–2050 |
| Net-zero electricity (advanced economies) | 2040–2050 |
| Net-zero electricity (global) | 2055–2065 |
| Industrial decarbonization | 2055–2070 |
| Aviation and shipping | 2060–2080 |
| True global net zero | 2065–2080 |
| 1.5°C target | Almost certainly missed; 2°C possible with urgent action |
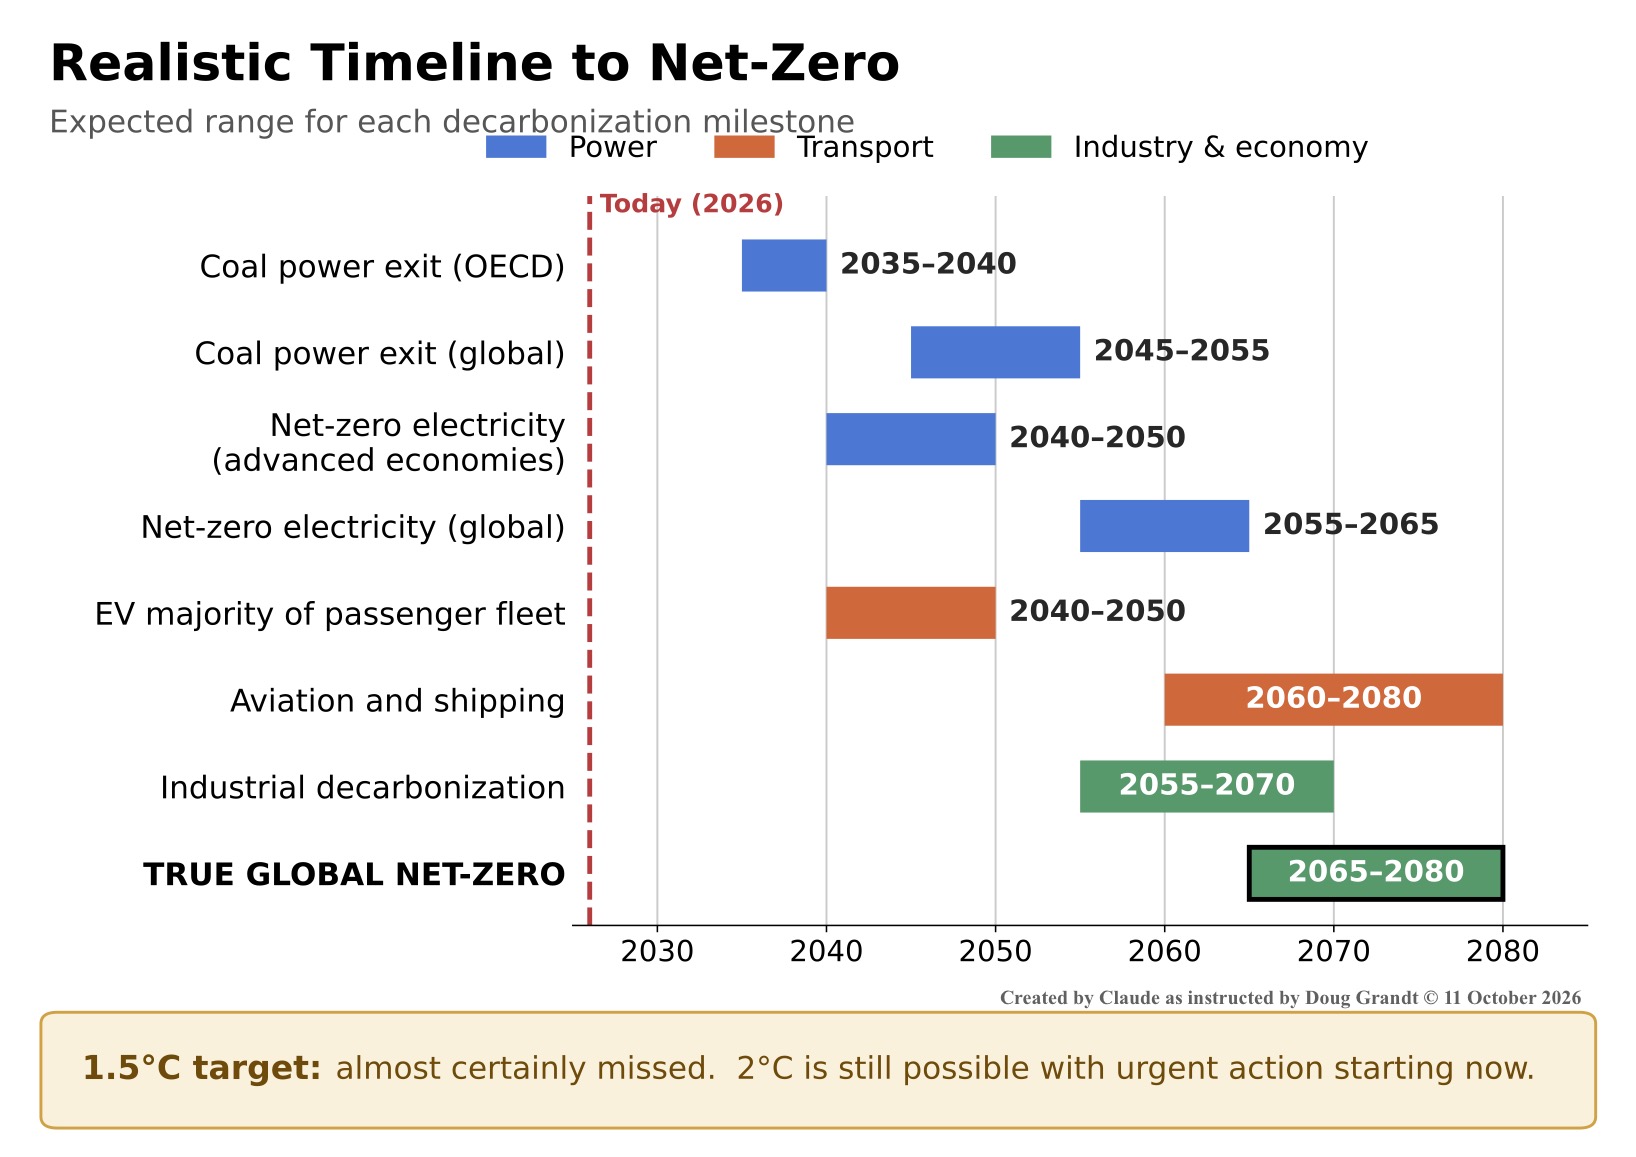
The pattern is clear. The power sector goes first, with advanced economies leading the rest of the world by about 10–15 years. The hardest sectors, aviation, shipping and heavy industry, have the widest and latest ranges, and those sectors are what push true global net zero out to 2065–2080.
2. Global cost versus benefit
No one keeps an audited global ledger of transition costs, so Figure 2 is a transparent model rather than a forecast. It counts only the extra spending and savings compared with sticking to current policies, in 2025 US dollars, and stretches published estimates to match the 2065–2080 net-zero timeline.
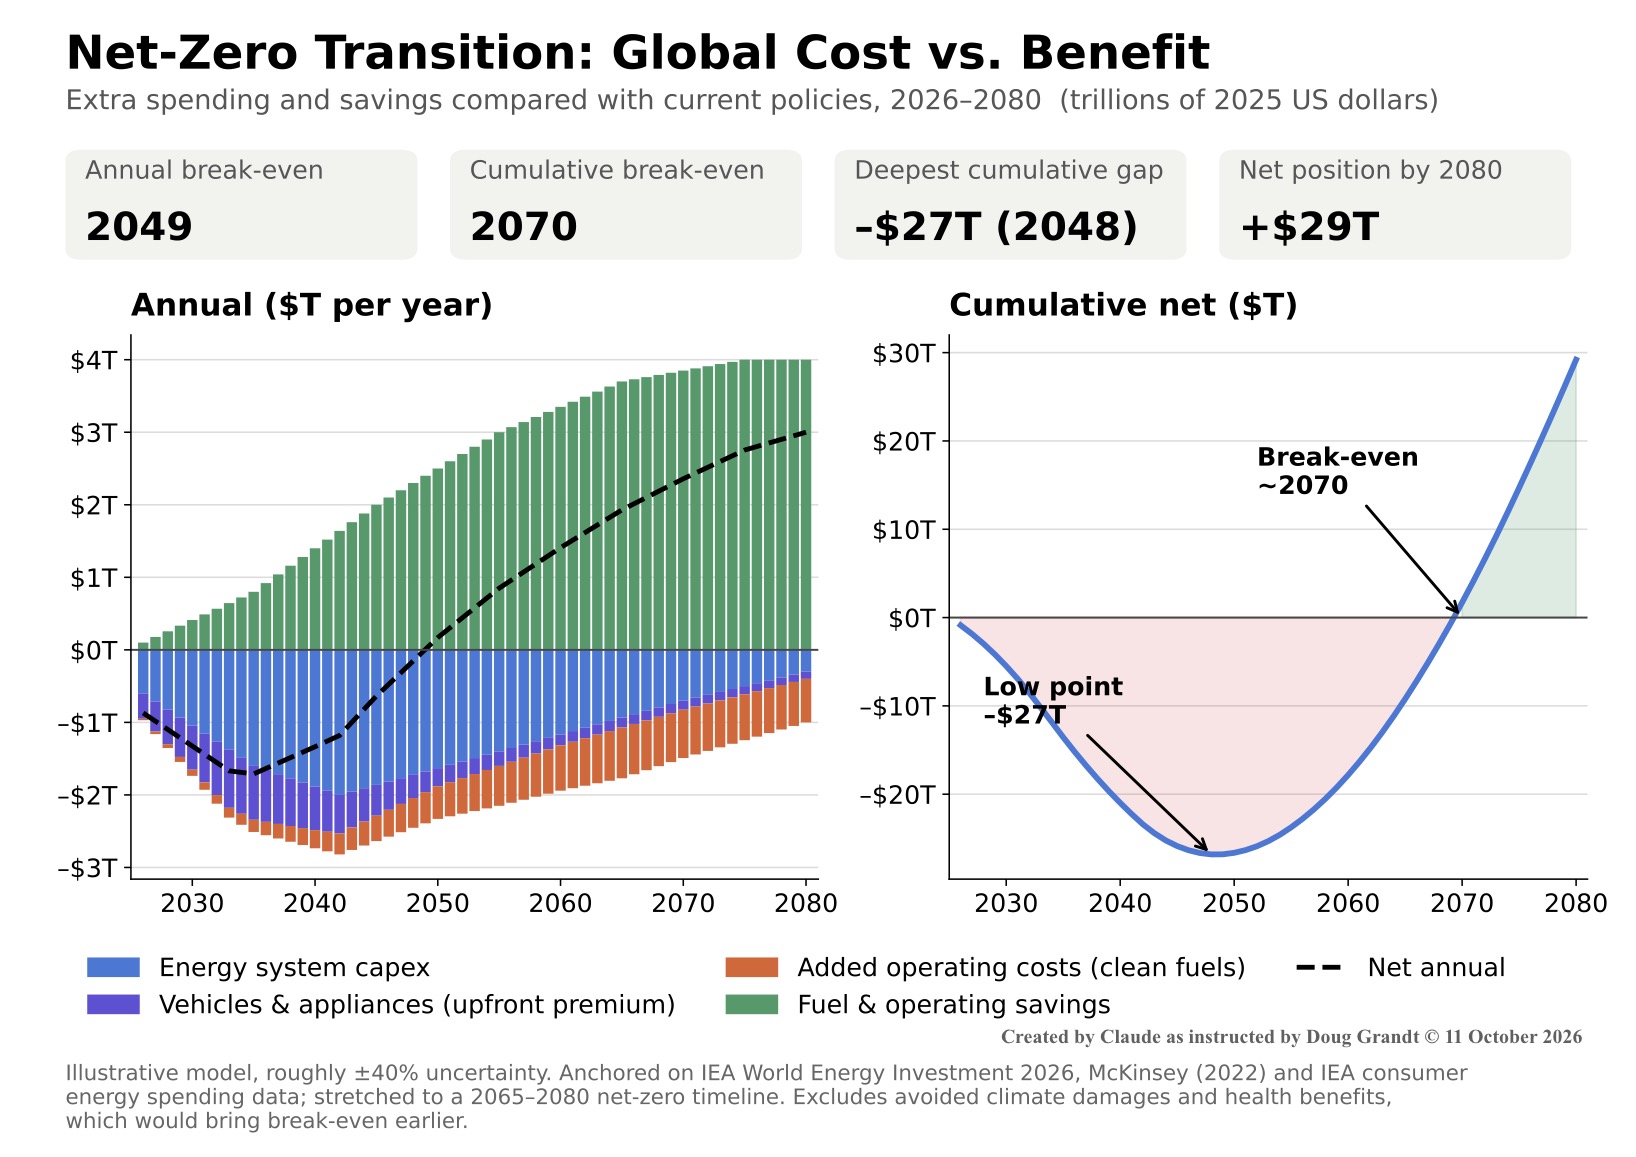
Anchor figures
- Global energy investment is expected to reach about $3.4 trillion in 2026, with about $2.2 trillion going to clean energy, almost double fossil fuel investment (IEA, World Energy Investment 2026).
- For a full 2050 net-zero transition, McKinsey estimated about $275 trillion of spending on energy and land-use assets, or $9.2 trillion a year on average, roughly $3.5 trillion a year more than current spending.
- Consumers worldwide spent around $10 trillion on energy in 2022, more than $1,200 per person. About half went to oil products and another third to electricity (IEA).
How the model is built
- Energy system capex (power, grids, storage, industry, hydrogen) peaks at about $2 trillion a year of extra spending in the early 2040s. That is below McKinsey’s $3.5 trillion because this timeline is slower than their 2050 path.
- Vehicles and appliances is the extra upfront price of EVs, heat pumps and insulation compared with fossil equivalents. It peaks in the early 2030s and shrinks as EVs reach price parity. Heat pumps keep a small premium; the UK Climate Change Committee expects them to remain more expensive than gas boilers even in 2050.
- Added operating costs mainly reflect pricier clean fuels for aviation, shipping and heavy industry, such as green hydrogen and sustainable jet fuel.
- Savings come from avoided oil, gas and coal, minus extra electricity bills. They reach roughly 40% of today’s consumer energy spending, consistent with IEA analysis that a net-zero path more than halves the energy system’s operating costs within a decade, but spread over a slower timeline.
Key results
The result is a J-curve. Annual savings overtake annual costs around 2049. The cumulative gap bottoms out at roughly –$27 trillion in 2048, breaks even around 2070, and reaches about +$29 trillion by 2080.
Caveats
- Treat every line as roughly ±40%. Fuel prices alone can move the break-even dates by a decade or more.
- The direction is well supported. A peer-reviewed Oxford study (Way et al., Joule, 2022) found a fast transition by around 2050 would save at least $12 trillion compared with continuing current fossil fuel use.
- Global totals hide who pays and who saves. In emerging markets, rising electricity use and appliance ownership could push household energy bills higher, while advanced economies see bills fall.
- The model excludes avoided climate damages and air-pollution health costs. Both would bring break-even earlier, likely by a lot.
3. CO2 emissions and the Keeling curve
Figure 3 starts from the latest measured data. Fossil fuels and net land-use changeproduced about 42.2 billion tonnes of CO2 in 2025 (Global Carbon Budget 2025). CO2 at Mauna Loa reached 432 ppm in May 2026, 1.8 ppm above May 2025 (Scripps/NOAA). The emissions path follows the Figure 1 timeline and reaches net zero around 2074.
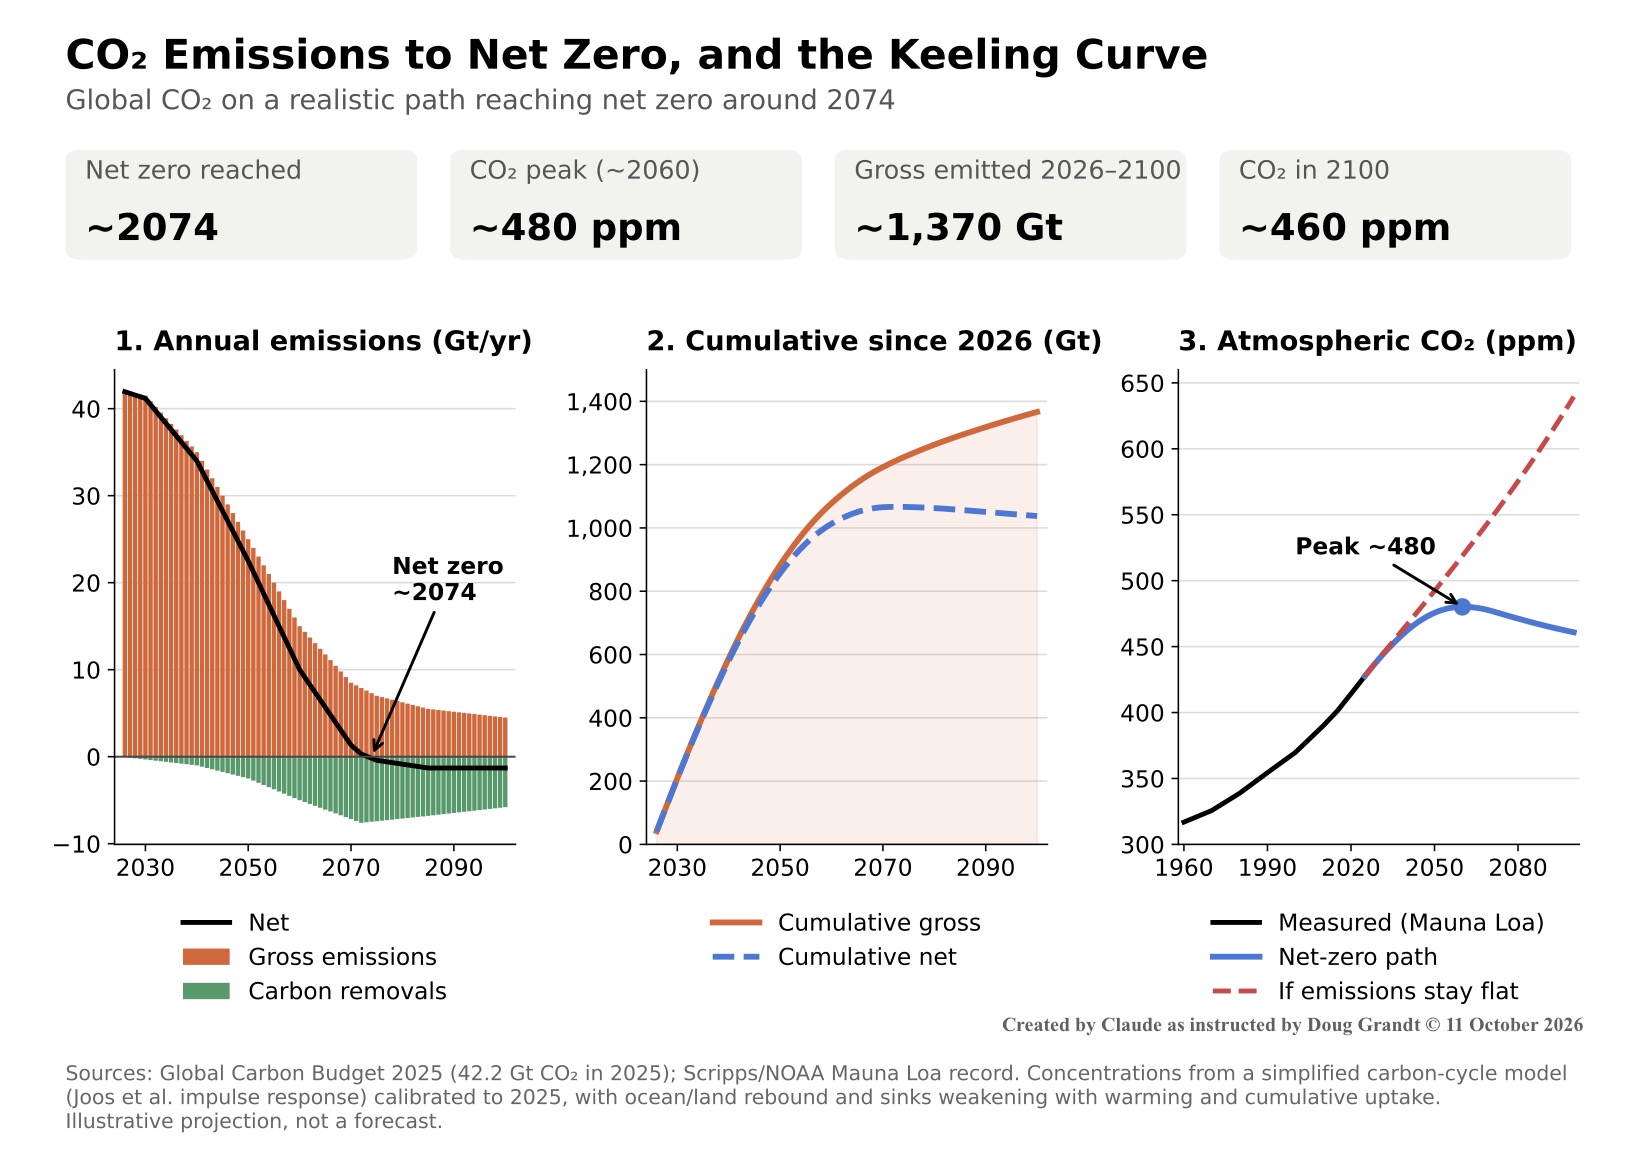
Key insight: CO peaks before net zero
Atmospheric CO2 peaks at about 480 ppm around 2060, more than a decade before net zero. CO2 stops rising once emissions fall to about what the oceans and forests absorb each year. After net zero, natural sinks keep slowly drawing CO2 down, so concentrations drift back toward about 460 ppm by 2100. If emissions instead stayed flat at today’s level, CO2 would reach about 640 ppm by 2100.
How the model is built
- Emissions path. Gross emissions start at 42 Gt and fall slowly at first, then steeply in the 2040s–60s as power, cars and industry decarbonize. A residual of about 5–7 Gt a year remains from aviation, shipping, cement and agriculture.
- Removals. Reaching net zero requires carbon removal (direct air capture, reforestation, bioenergy with carbon capture) to scale to about 7 Gt a year by the 2070s. That industry is tiny and unproven today, which makes it the weakest link in this path.
- Keeling curve. Concentrations come from a standard simplified carbon-cycle model (the Joos et al. impulse response), calibrated to match 2025 observations. Ocean and land sinks weaken as the world warms and as they absorb more carbon, and recover as warming eases; climate impacts on sinks already account for about 8% of the rise in CO2 since 1960. The sink weakening is calibrated to match the coupled FaIR-style model inthe companion briefing Net Zero Plus Carbon Removal, so both briefings show the same net-zero path.
Putting it in context
Net emissions of roughly 1,065 Gt before net zero compare with a remaining 1.5°C carbon budget of only about 170 Gt, about four years at 2025 emissions. That matches the Figure 1 verdict: 1.5°C missed, with peak warming likely in the 2°C range.
4. Global temperature
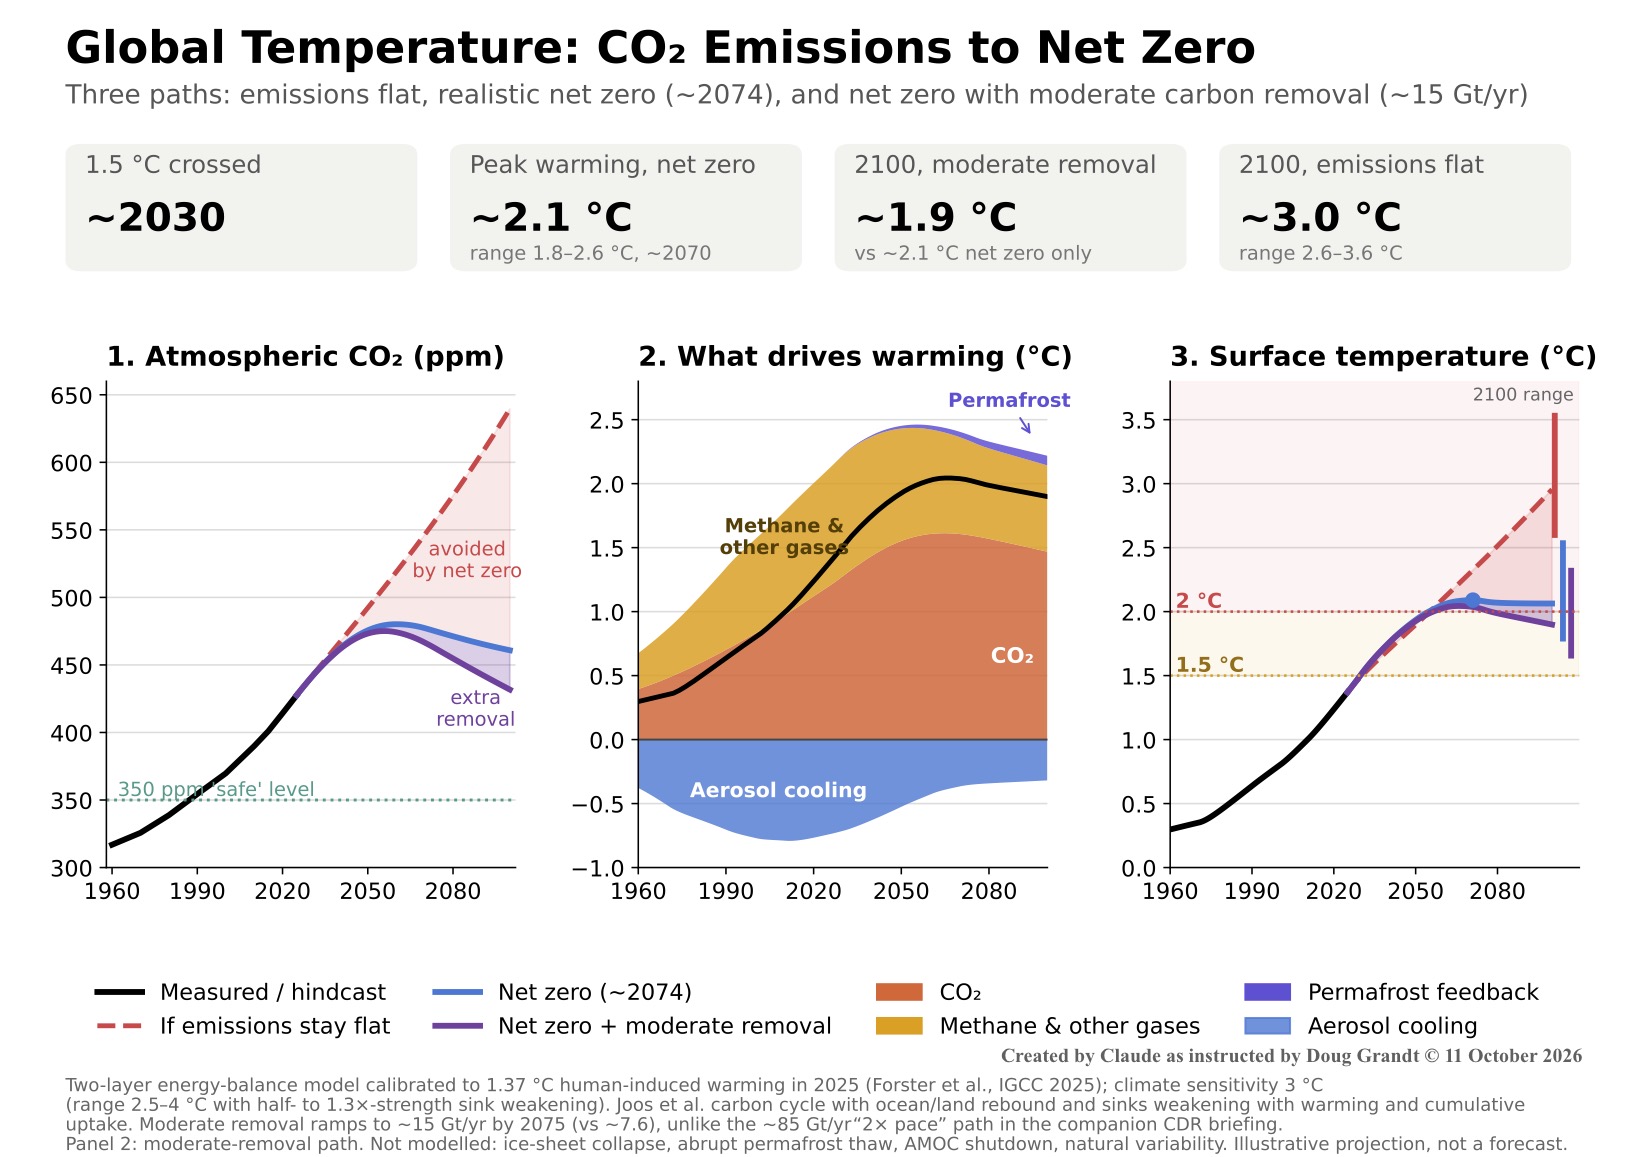
Figure 4 converts the CO2 path from Figure 3 into global mean surface temperature (GMST).
It compares three paths: emissions held flat at today’s level, the realistic net-zero path reaching net zero around 2074, and the same path with a moderate increase in carbon removal.
How the model is built
- Climate model. A two-layer energy-balance model, the kind the IPCC uses to emulate full Earth-system models, with a fast surface layer and a slow deep ocean. It is calibrated to the latest measurements: human-induced warming reached 1.37°C above 1850–1900 in 2025 (Forster et al., Indicators of Global Climate Change 2025).
- Climate sensitivity. The central case assumes 3°C of eventual warming per doubling of CO2, with a range of 2.5–4°C (IPCC AR6 “likely” range). For each sensitivity, the strength of aerosol cooling is set so the model reproduces observed warming to date, which is why higher sensitivities also unmask more warming later.
- Feedbacks. Fast feedbacks (water vapor, clouds, melting ice and snow) are built into theclimate sensitivity. Weakening ocean and land carbon sinks are included in the CO2 model, at half strength in the low case and 1.3× strength in the high case. Permafrost thaw is added as an explicit extra source, contributing under 0.1°C by 2100 on the net-zero paths.
- Moderate carbon removal. Removal ramps to about 15 Gt CO2 a year by 2075, double the roughly 7.6 Gt in the base net-zero path, bringing net zero forward to about 2065 and making net emissions about –10 Gt a year by 2100. This is a different, much smaller program than the “2× pace” scenario in the companion briefing, where removal capacity grows by about 1.9 Gt every year and reaches about 85 Gt a year by 2080.
Reading the panels
- Atmospheric CO2 (panel 1). The red shading shows CO2 avoided by reaching net zero; the purple shading shows the extra drawdown from faster removal, which brings concentrations to about 430 ppm by 2100 versus about 460 ppm without it. Both remain well above the 350 ppm level often cited as a long-term safe target.
- What drives warming (panel 2). CO2 (orange) is the dominant driver and stops growing once net zero is reached. Methane and other gases (amber) decline as fossil-fuel production winds down, though agriculture keeps some in place. Aerosol cooling (blue) has been masking roughly 0.75°C of warming; it fades as coal and oil are phased out, partly offsetting the methane cuts and keeping warming rising into the 2060s. Permafrost (violet) adds a thin but growing layer.
- Surface temperature (panel 3). Warming crosses 1.5°C around 2030, passes 2°C in the mid-2050s and peaks near 2.1°C (range 1.8–2.6°C) around 2070 on the net-zero path. It then levels off rather than falling: CO2 declines, but the deep ocean is still catching up with past warming, and the two roughly cancel. With moderate removal, warming eases toabout 1.9°C by 2100. If emissions stayed flat, warming would reach about 3.0°C (2.6–3.6°C) by 2100. Until about 2055 the flat path is briefly no warmer than net zero, because phasing out fossil fuels also removes their cooling aerosol haze. The bars at the right edge show each path’s 2100 range across climate sensitivities.
Why carbon removal does less than you might expect
Moderate removal, about 370 Gt of extra removal by 2100, cools the planet by only about0.15°C (range 0.13–0.22°C) by 2100. Two physical effects limit it. First, as CO2 is pulled out of the air, oceans and land release some of their stored carbon back: here roughly 40% of the extra removal is offset by this rebound, close to the 46% found in the companion briefing. Second, the deep ocean releases stored heat slowly, so surface temperatures lag CO2 by about a decade. Much larger cooling is physically possible but needs removal on anenormous scale: the companion briefing’s “2× pace” scenario, reaching about 85 Gt a yearby 2080 (about twice today’s total emissions), returns CO2 to about 290 ppm by the mid-2080s and warming to about 0.8°C by 2100. Running that removal schedule through this briefing’s model gives nearly the same result. Carbon removal can lower temperatures, but the cooling scales with the tonnage, and the tonnage needed for large cooling is far beyond any IPCC pathway.
Caveats
- The 1.8–2.6°C peak range reflects climate sensitivity and the strength of sink weakening. Year-to-year natural variability adds about ±0.2°C, so individual years will cross 2°C before the long-term average does.
- The model excludes tipping points such as ice-sheet collapse, abrupt permafrost thaw, Amazon dieback and a shutdown of the Atlantic ocean circulation (AMOC), any of which could add warming or regional disruption beyond the ranges shown.
- The remaining 1.5°C carbon budget from the start of 2026 is about 130 Gt CO2, a little over three years of current emissions, which is why the curves cross 1.5°C around 2030.
5. Economic effects
Figure 5 traces how the transition could affect the wider economy. Every line shows the difference from a current-policies world, not absolute levels, so a reading of +2% means 2% better than the economy would otherwise be. Like the other figures, these are directional curves built from published macro modelling, not forecasts.
Anchor figures
- The IMF (World Economic Outlook, October 2022, Chapter 3) estimated that a credible transition policy package could slow global growth by 0.15–0.25 percentage points a year until 2030 and raise inflation by 0.1–0.4 points. The growth cost is smaller for China, the US and the EU (0.05–0.20 points) and larger for fossil-fuel exporters and energy-intensive emerging economies.
- The Network for Greening the Financial System (NGFS, Phase V, 2024) estimated global GDP losses from climate damage by 2050 of about 15% under current policies versus about 7% under a net-zero-by-2050 path, a gap of roughly 8 percentage points.
Reading the panels
- GDP (panel 1). The transition cost (orange) is a drag of about 1% through the 2030s. Avoided climate damage (green) grows over time, and the net effect (black) turns positive in the early 2040s. The avoided-damage line sits at about +2.5% in 2050, well below the 8-point NGFS gap, for two reasons: this path reaches net zero around 2074 rather than 2050, so it avoids less warming by mid-century; and NGFS has since issued a notice to readers about the academic study behind its higher damage estimates. The shaded band shows the plausible range, with the upside reflecting the NGFS figures.
- Inflation (panel 2). Mild “greenflation” of up to about 0.3 points in the 2030s comes from carbon pricing and heavy investment demand. It fades by the mid-2040s and is followed by slight disinflation as cheap renewables replace volatile fossil fuels. True deflation is not expected, because central banks would offset it.
- Household income (panel 3). Advanced-economy households come out ahead first, from the late 2030s, as energy bill savings build. Emerging-economy households wait until around 2050, because rising electricity use and appliance ownership offset savings at first, but gain more later because they suffer more from climate damage.
- Other indicators (panel 4). Green cells are favorable for the economy and red cells unfavorable. Resilience to energy shocks improves steadily, which matters because oil-price spikes have historically triggered many recessions. Higher investment demand puts upward pressure on interest rates and public debt early on. Fossil-fuel exporters and owners of stranded fossil assets face their hardest decades in the 2040s and 2050s.
Caveats
- Timing and credibility matter. The IMF warns that delay makes the transition costlier, bringing slower growth and higher inflation; a late, disorderly transition would deepen the early dip.
- Avoided climate damage is the most uncertain element in this figure, which is why the GDP range is wide and widens over time.
Sources
International Energy Agency, World Energy Investment 2026; IEA, Strategies for Affordable and Fair Clean Energy Transitions (2024). McKinsey Global Institute, The Net-Zero Transition (2022). Way, R. et al., “Empirically grounded technology forecasts and the energy transition,” Joule (2022). UK Climate Change Committee, via Resolution Foundation analysis. Global Carbon Project, Global Carbon Budget 2025. Scripps Institution of Oceanography and NOAA Global Monitoring Laboratory, Mauna Loa CO2 record. Joos, F. et al., carbon dioxide impulse response functions, Atmos. Chem. Phys. (2013). International Monetary Fund, World Economic Outlook, October 2022, Chapter 3. Network for Greening the Financial System, NGFS Climate Scenarios Phase V (2024). Forster, P. et al., “Indicators of Global Climate Change 2025,” Earth System Science Data (2026). IPCC, Sixth Assessment Report, Working Group I (2021). Millar, R. et al., FaIR simple climate model, Atmos. Chem. Phys. (2017). Companion briefing: Net Zero Plus Carbon Removal October 2026). All projections are illustrative models built from these sources, not forecasts.


