
Part 2 of 2
The October 12 PDF version is difficult for some to read, so this TEXT v.2 is reposted at the suggestion of a reader. I hope this is easier to understand.

Preface – Two “briefings” (Part 1 and Part 2) prepared by Claude AI under my instructions—drawing on four previous queries in May—are quite deep and dense with assumptions, numbers and dates, so I asked Claude to prepare a synopsis and synthesis of the two (this preface is being added to Part 1 as well). Following is what Claude prepared in summary, intended as a letter or email of transmittal to people of influence::
Two climate briefings, in plain English
These are two short briefings on what it would take to stabilize the climate. They are dense, so here is the gist of each and what they mean together.
1. The Road to Net Zero. This briefing asks what happens if the world keeps decarbonizing at a realistic pace. Power plants and cars clean up first. Airplanes, ships, steel and cement come last, so true global “net zero” (no more CO₂ added each year) arrives around 2065–2080, not 2050. CO₂ in the air keeps climbing to about 480 ppm around 2060, compared with 432 today, and then drifts down only slowly. Warming passes 1.5 °C around 2030 and peaks near 2.1 °C around 2070. After that it levels off but does not fall. The transition costs more up front, but lower fuel bills pay it back by about 2070, and the overall economy comes out ahead from the 2040s on. Net zero stops the damage from getting worse. It does not undo the damage already done.
2. Net Zero Plus Carbon Removal. This briefing asks what it would take to go further and actually return the atmosphere to pre-industrial CO₂ levels of about 280–300 ppm. The answer is an industry that pulls CO₂ back out of the air through forests, soils, crushed rock and machines. By 2080 it would have to remove about 85 billion tonnes a year, roughly twice what the whole world emits today. If that were done, warming would peak near 1.9 °C around 2052, drop back below 1.5 °C around 2074, and fall to about 0.8 °C by 2100. The price is about $8 trillion a year, around $215 trillion in total. It only makes economic sense once you count the climate damage it prevents, because removing carbon saves no one any money on fuel. The oceans also push back: as CO₂ is pulled from the air, the seas release some of what they absorbed. Nearly half of every tonne removed is cancelled out this way.
Taken together. The two briefings agree on three hard truths:
- Cutting emissions is necessary but not enough. Even a successful transition leaves us stuck at about 2 °C for centuries.
- The only way back down is to take carbon out. That takes an effort as large as the energy transition itself, built alongside it and not in place of it, and it would have to keep running indefinitely to hold the gains.
- The cost of acting is real, but the cost of not acting is larger. Once avoided climate damage is counted, both paths leave the world economy better off, and the sooner we start, the cheaper it gets.
Think of the first briefing as turning off the tap. The second briefing is about bailing out the bathtub, and the bathtub keeps leaking water back in.
The carbon-removal scenario is best read as an upper bound on what it would take, not a forecast of what will happen. It is several times larger than anything in the IPCC’s pathways, and neither briefing models tipping points such as ice-sheet collapse.
With best regards,
Doug Grandt
Claude added this final editorial which does not require action as the difference noted will probably only be noticed by the most intense reviewer, for which these are not intended:
I noticed one thing worth fixing before you send. Section 3 of the carbon-removal riefing says the net-zero-only path “peaks higher than in the companion briefing: about 482 ppm … rather than 463 ppm.” But 463 ppm is the carbon-removal path’s own peak. The companion briefing’s figure is about 480 ppm, so the two briefings actually agree. The sentence should say that, or be dropped.
Net Zero Plus Carbon Removal
Returning CO2 to Holocene levels: timeline, costs, the Keeling curve and economic effects
Overview
This briefing extends The Road to Net Zero by adding one measure, and a new temperature view,: a global CO2 removal (CDR) program of all types, from forests and soils to enhanced rock weathering, bioenergy with carbon capture and direct air capture. It ramps up from 2035 to 2080 at twice the pace at which emissions are being cut, with the goal of removing the excess CO2 humans have added to the atmosphere and oceans and returning to Holocene concentrations of 280–300 ppm.
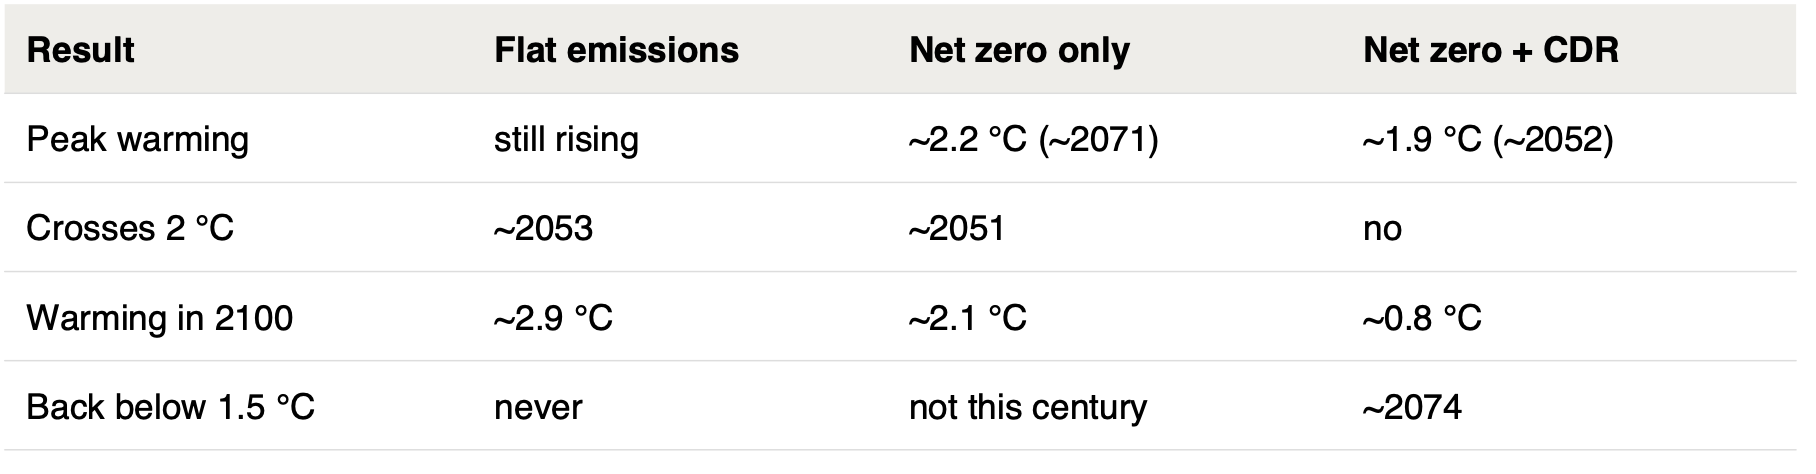
The five views tell a consistent story. CDR at this scale changes the climate picture completely: net zero arrives around 2049 instead of 2074, CO2 peaks lower and earlier at about 463 ppm (versus about 482 ppm without removal), falls back below 350 ppm around 2075, and reaches about 290 ppm by the mid-2080s. Global temperature follows a decade or so behind: it peaks at about 1.9°C around 2052, drops back below 1.5°C around 2074 and falls to about 0.8°C by 2100. The price is enormous. Removal grows to about 85 billion tonnes a year, roughly twice today’s total emissions, costing about $8 trillion a year by 2080 and about $215 trillion in total. Unlike clean energy it saves no fuel, so it only pays off once avoided climate damage is counted. On that basis the economy ends up clearly ahead from the late 2050s.
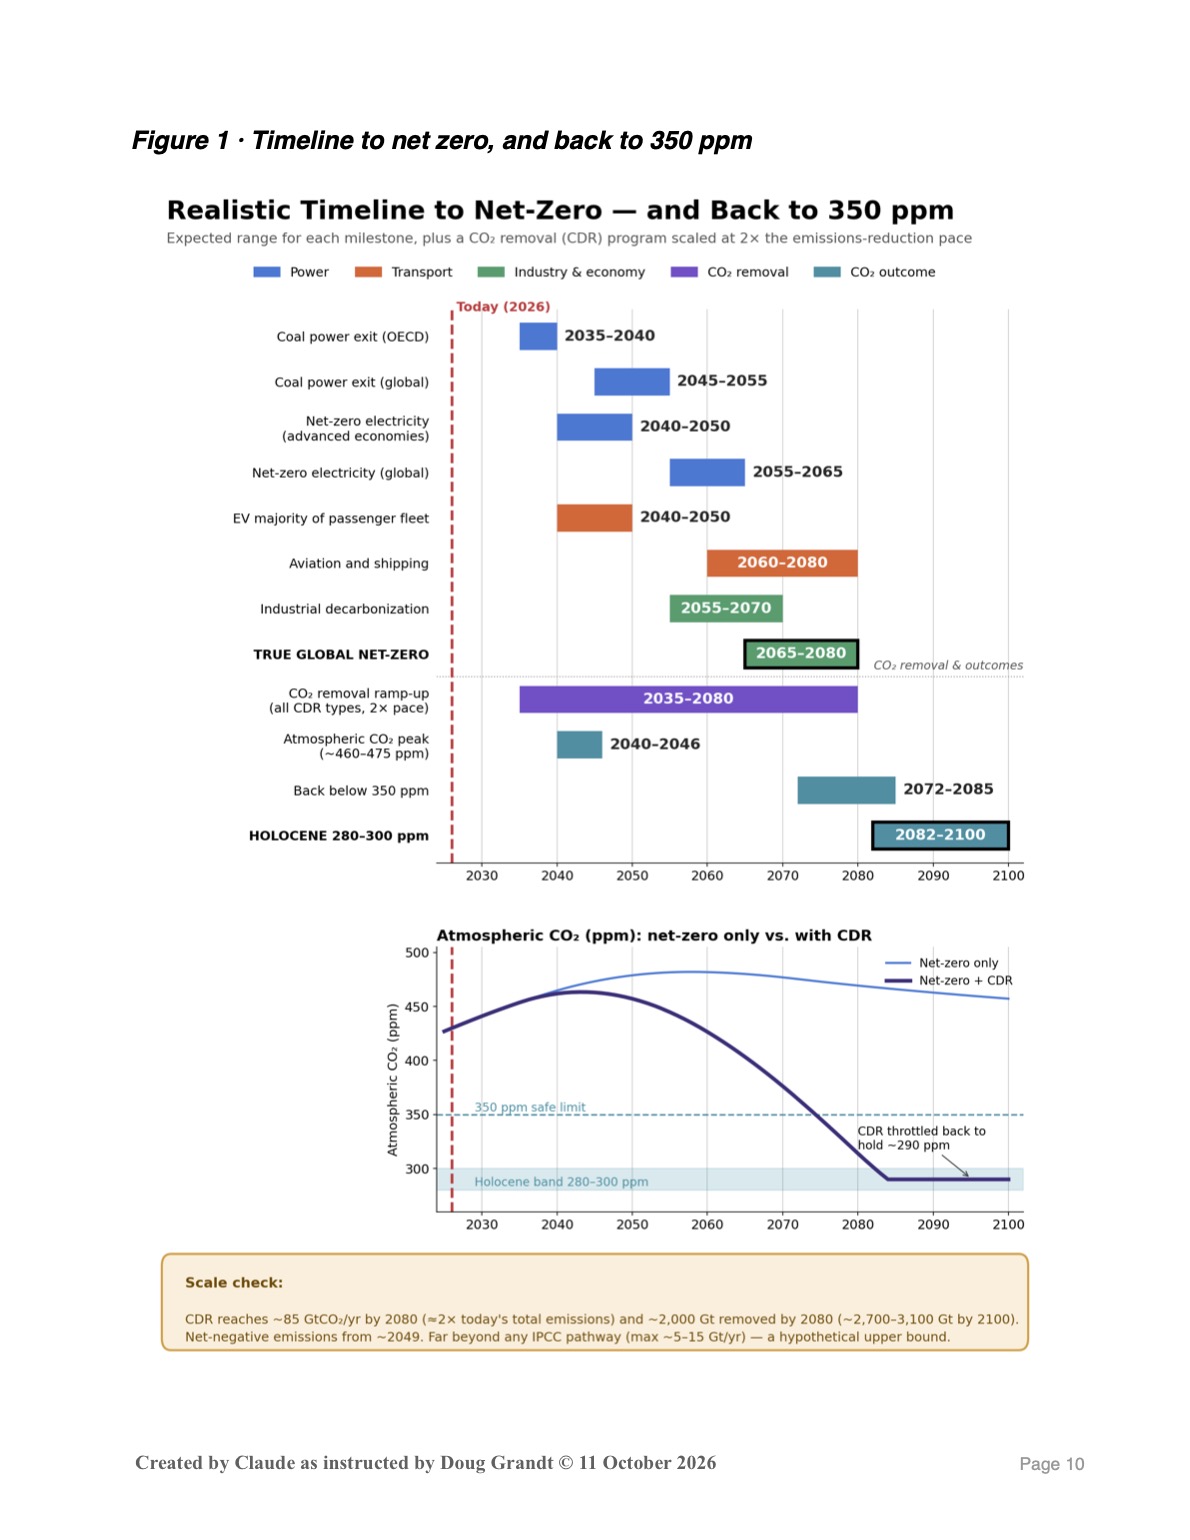
1. Timeline to net zero, and back to 350 ppm
The energy milestones are unchanged; CDR is added on top of them, not instead of them. Removal starts small in 2035 and grows by about 1.9 billion tonnes a year, every year. Because it scales so fast, it overtakes the remaining emissions around 2049, decades before aviation, shipping and heavy industry are fully decarbonized.
| Milestone | Realistic range |
| Energy transition milestones (Figure 1, previous briefing) | Unchanged |
| CO2 removal ramp-up (all types, 2× pace) | 2035–2080 |
| Net-zero (net emissions) | ~2049 (vs. 2065–2080 without CDR) |
| Atmospheric CO2 peak, ~460–475 ppm | 2040–2046 |
| Back below 350 ppm | 2072–2085 |
| Holocene levels, 280–300 ppm | 2082–2100 |
2. Global cost versus benefit
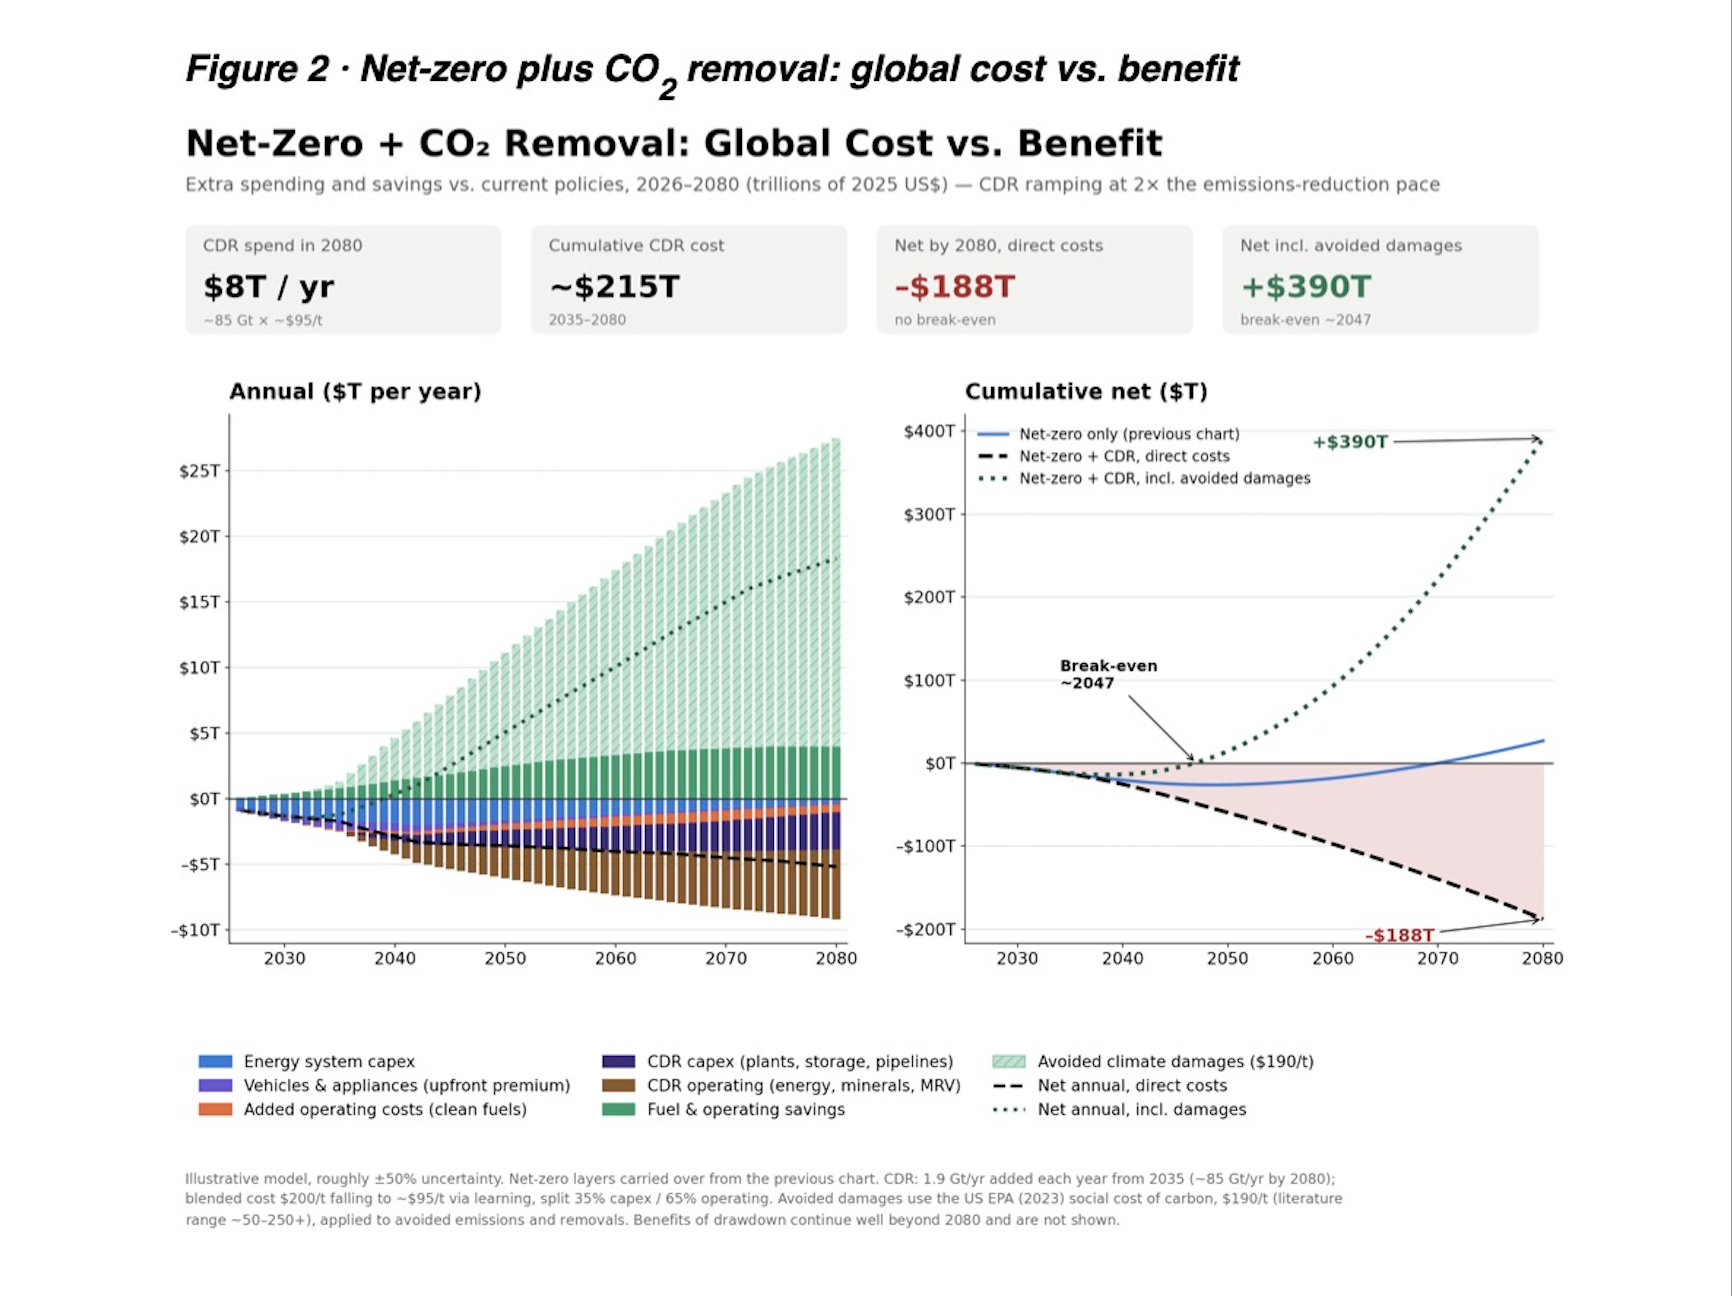
Figure 2 keeps the energy-transition layers from the previous briefing and adds two CDR layers. Because removal produces no fuel savings, the chart shows the result two ways: direct costs only, and with avoided climate damages included.
How the model is built
- Volume. 1.9 Gt a year of new removal capacity each year from 2035, reaching about 85 Gt a year by 2080 and about 2,000 Gt removed in total by then.
- Cost. A blended cost of about $200 per tonne in 2035, falling to about $95 by 2080 through learning. That is optimistic for direct air capture but realistic for a mix of methods. Nature-based options run out at roughly 5–10 Gt a year, so most removal must be engineered.
- Split. About 35% capital (plants, pipelines, storage) and 65% operating costs (energy, rock and minerals, monitoring).
- Avoided damages. The US EPA’s 2023 central social cost of carbon, $190 per tonne, applied to both avoided emissions and removals.
Key Results
CDR spending reaches about $8 trillion a year by 2080, roughly 2–2.5% of world GDP. On direct costs alone, the +$29 trillion gain from the energy transition is swamped and the cumulative position ends near –$188 trillion with no break-even. Including avoided damages, the cumulative position breaks even around 2047 and reaches about +$390 trillion by 2080.
Caveats
- The damage estimate decides the verdict. Published social-cost-of-carbon values range from about $50 to more than $250 per tonne; at roughly $70 the benefits only offset the costs. The current US administration has withdrawn the EPA figure.
- Removal is a public good: nobody’s bills fall when CO2 is removed, so it needs carbon pricing mandates or public money.
- Holding CO2 near 290 ppm after the 2080s would still cost an estimated $1–3 trillion a year in ongoing removal.
3. CO2 emissions and the Keeling curve
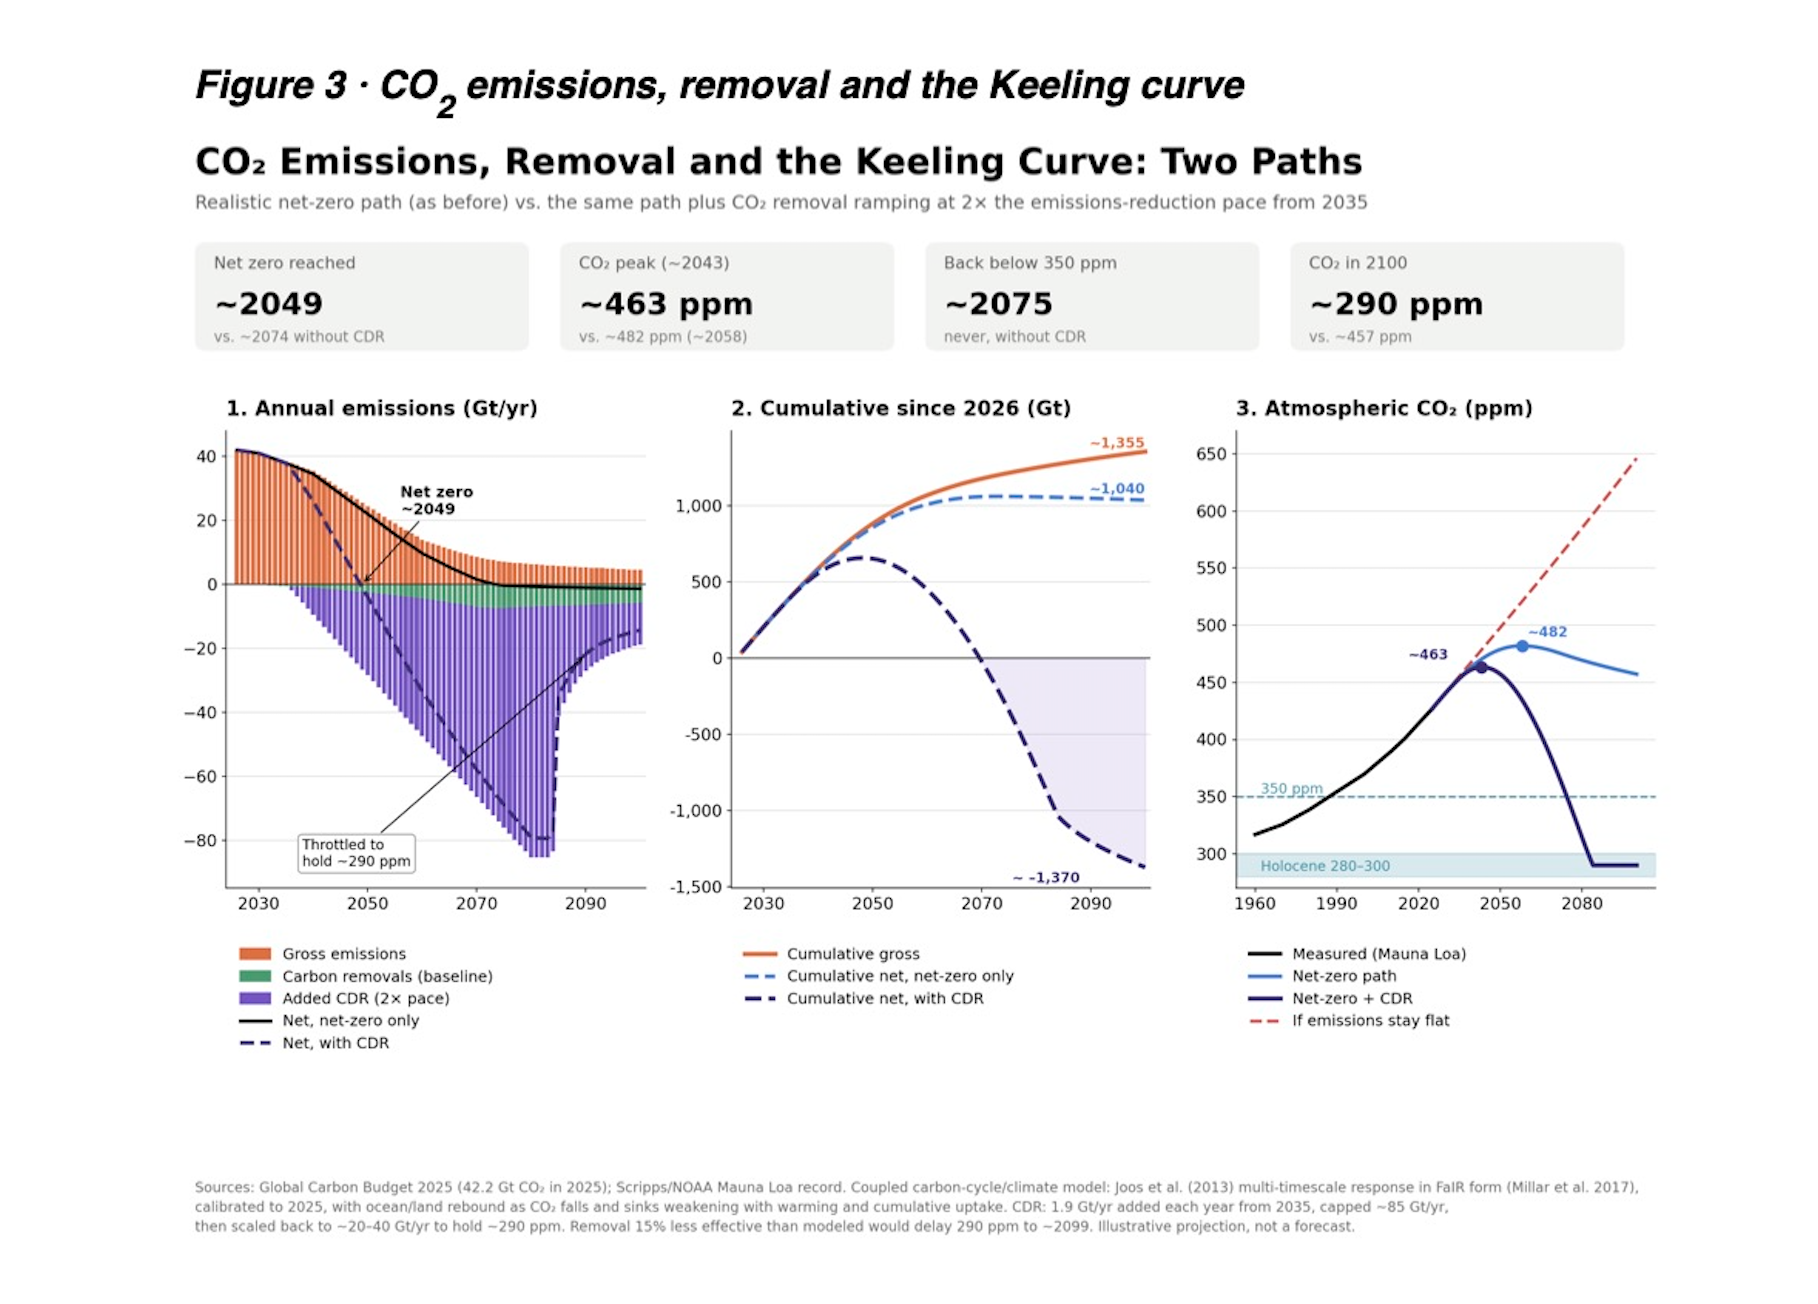
Figure 3 starts from 42.2 billion tonnes of CO2 in 2025 (Global Carbon Budget 2025) and uses a coupled carbon-cycle and climate model calibrated to observations. It includes the multi-timescale Jooset al. (2013) carbon cycle, in the FaIR form of Millar et al. (2017), so the ocean and land release CO2 back to the air as concentrations fall, and sinks weaken as the world warms. Because of that sink weakening, the net-zero-only path here peaks higher than in the companion briefing: about 482 ppm around 2058 rather than 463 ppm, ending 2100 near 457 ppm rather than 435 ppm.
Key insight: the oceans push back
Removing a tonne of CO2 from the air lowers concentrations by less than adding a tonne raised them, because the oceans and land release some of the CO2 model the extra 2,400 Gt removed compared with net zero alone lowers CO in 2100 by only about 1,300 Gt-equivalent: roughly 46% is offset by this rebound. That is why getting back to 290 ppm needs about 2,000 Gt of removal by 2080, far more than the roughly 1,100 Gt the atmosphere gained since 1850, and why removal of about 20–40 Gt a year must continue afterwards just to hold the level.
Results
- Net zero around 2049, 25 years earlier than without CDR.
- Peak CO about 463 ppm around 2043, versus about 482 ppm around 2058.2
- Below 350 ppm around 2075; never this century without CDR.
- CO2 in 2100 about 290 ppm, versus about 457 ppm. Cumulative net emissions from 2026 to 2100 swing from about +1,040 Gt to about –1,370 Gt.
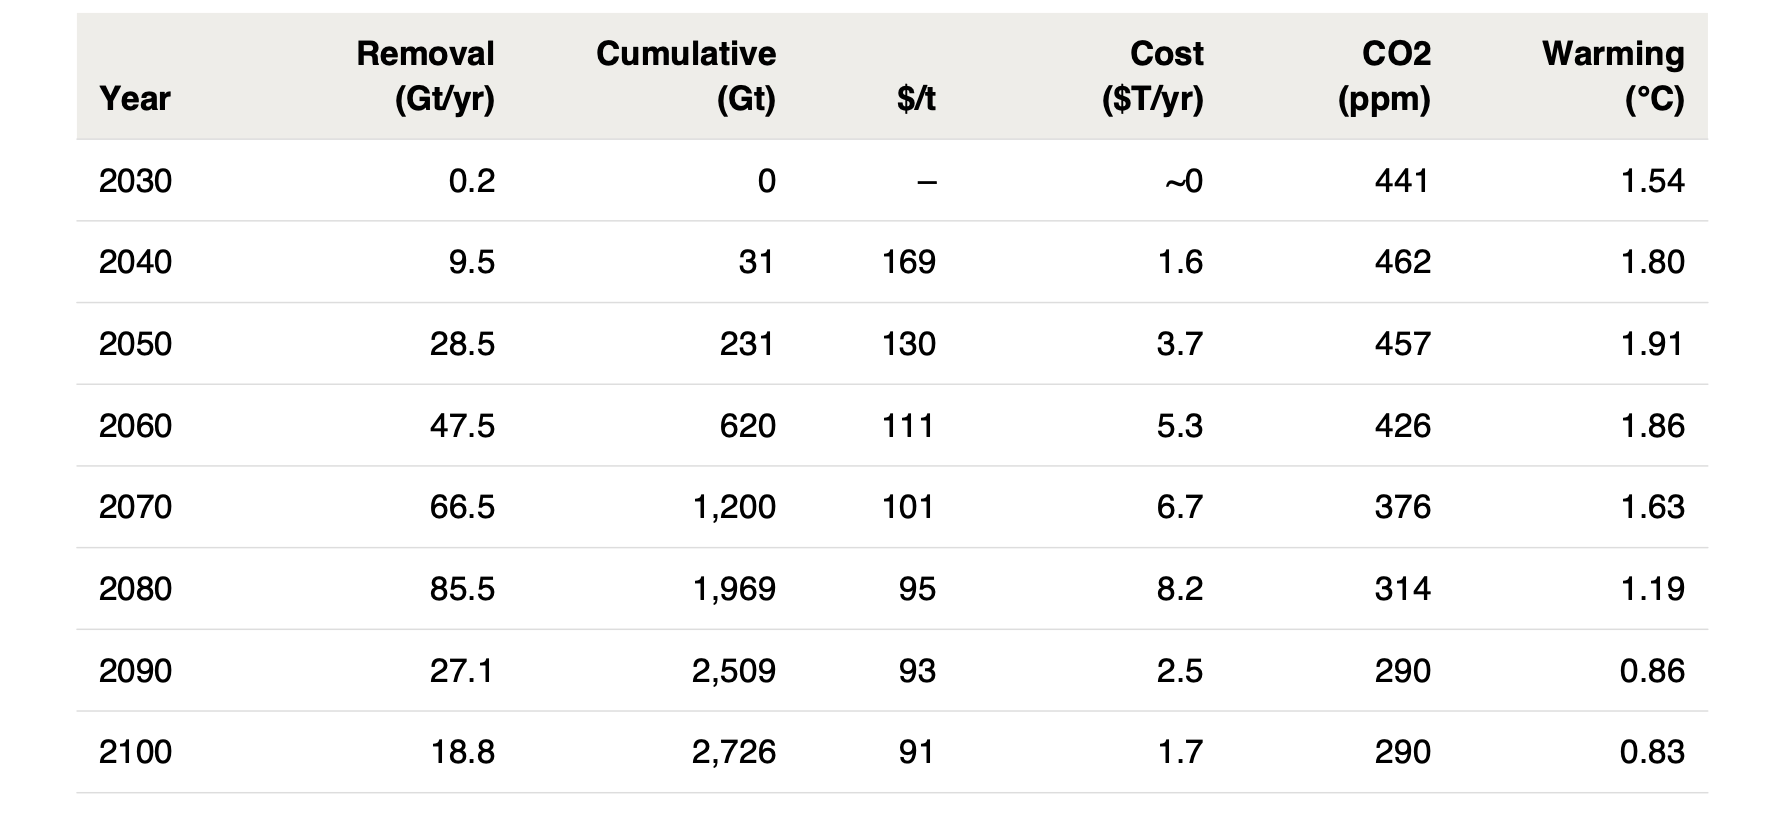
Re-check: removal needed to reach and hold 290 ppm
The table shows the coupled model year by year. Removal follows the 2× ramp until about 2084, when 290 ppm is reached, then is scaled back to hold that level. Costs use the blended cost per tonne from Figure 2.
Sensitivity tests
- Removal 15% less effective than modeled, reflecting the asymmetry noted in IPCC AR6: 290 ppm is not reached until about 2099, and cumulative removal rises to about 3,100 Gt, roughly $35 trillion more.
- Sink weakening twice as strong: CO2 peaks near 483 ppm and 290 ppm slips to about 2086.
- Climate sensitivity of 4°C: peak warming rises to about 2.3°C; 290 ppm is still reached around 2084.
4. Global mean surface temperature
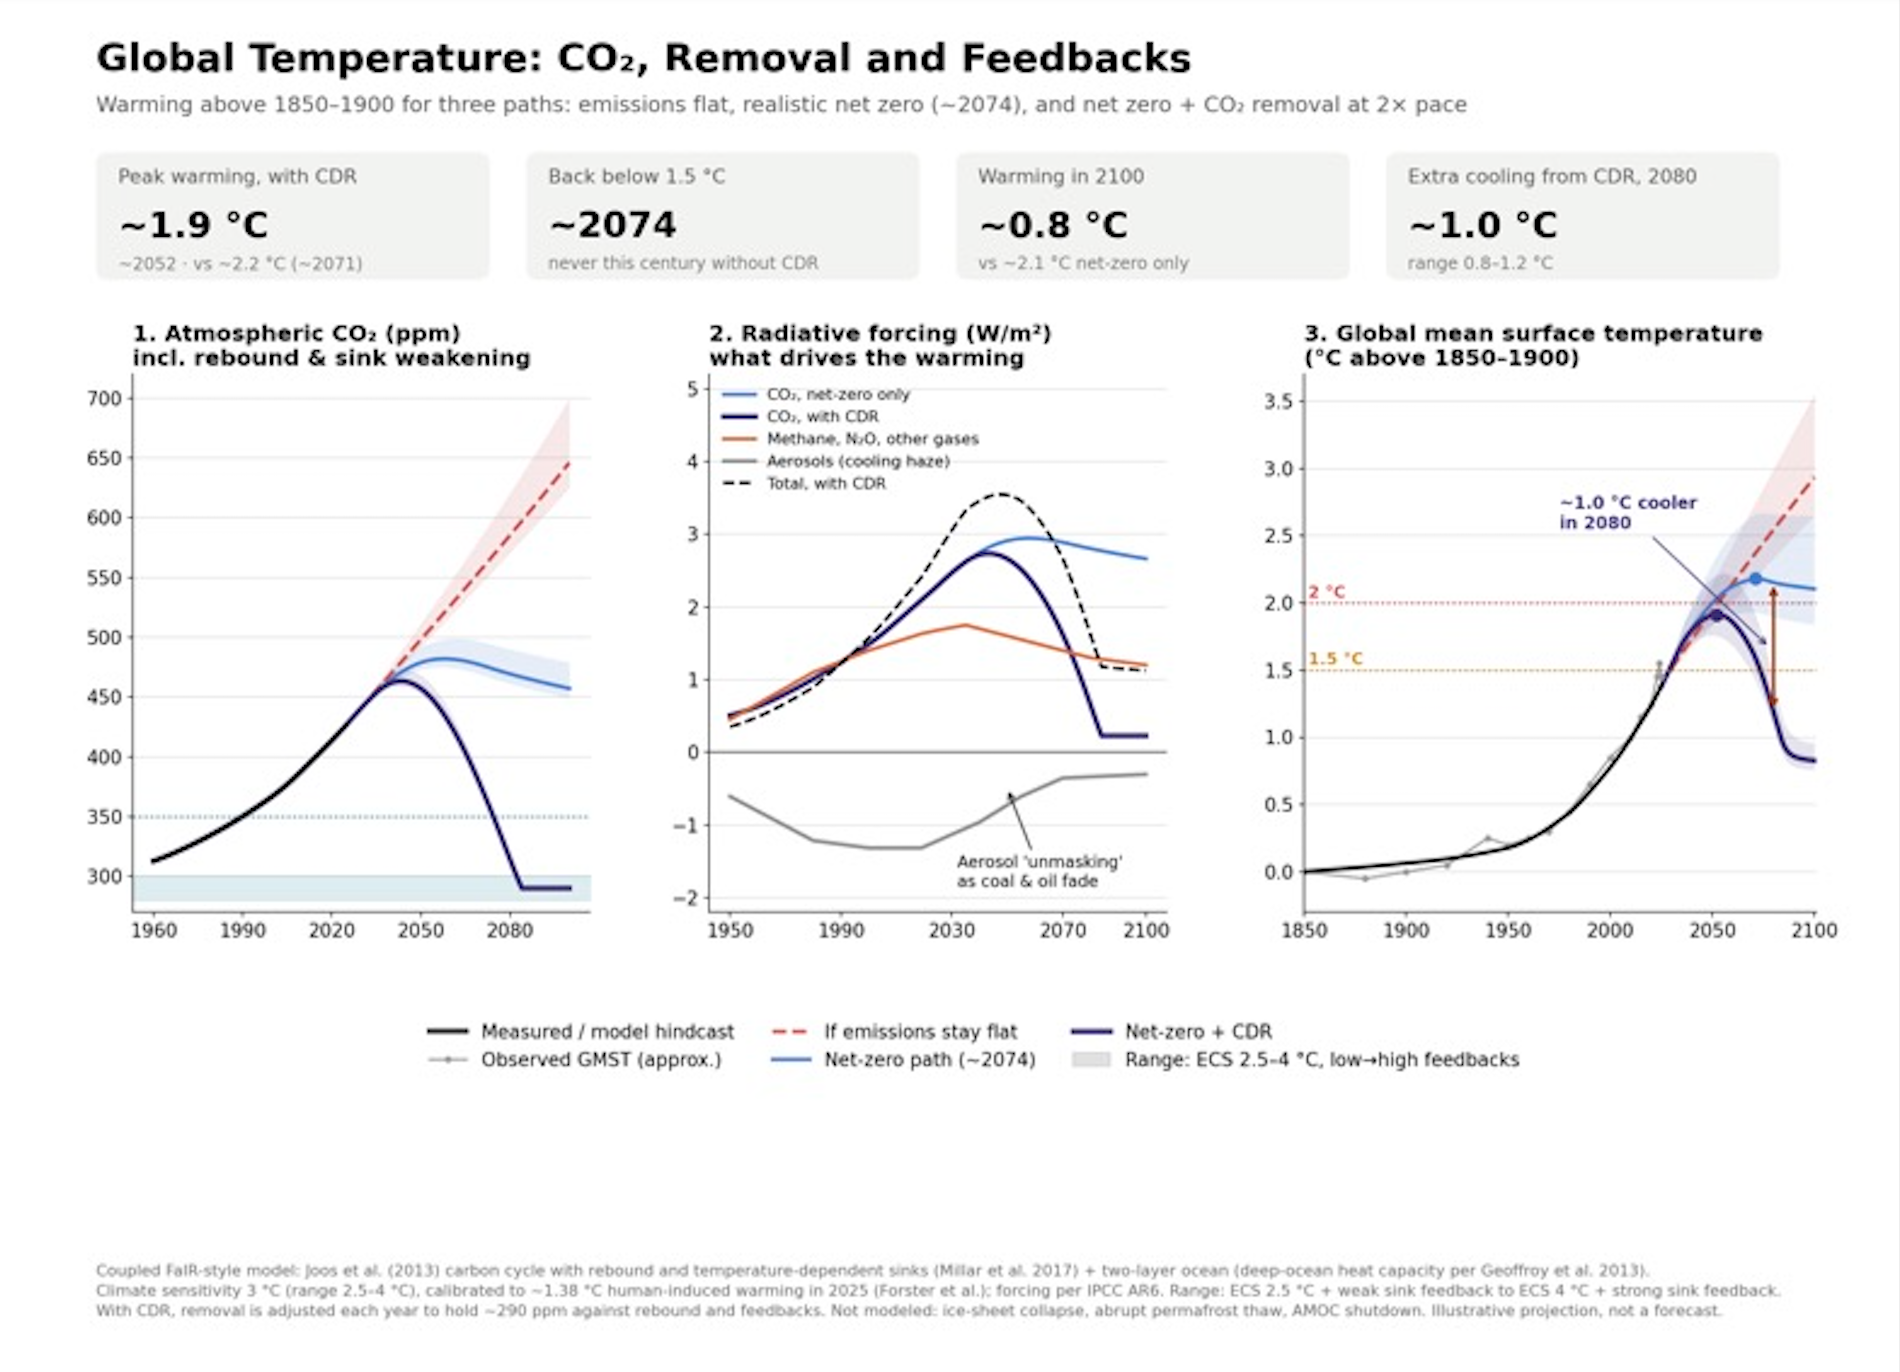
Figure 4 converts the CO2 paths from Figure 3 into global mean surface temperature, measured against 1850–1900. It adds a third path in which emissions stay flat, and shows the effect of methane, nitrous oxide, aerosols and Earth-system feedbacks alongside CO2.
How the model is built
- Climate model. A two-layer energy-balance model, the kind used to emulate the IPCC’s full Earth-system models, with deep-ocean heat capacity set to the CMIP5 model average (Geoffroy et al., 2013). A fast upper ocean and slow deep ocean make temperature lag CO2 and limit how fast the surface can cool, to at most about 0.05 °C a year.
- Sensitivity. 3°C of warming per doubling of CO2, the IPCC’s best estimate, with a 2.5–4°C range. The model is calibrated to about 1.38°C of human-caused warming in 2025.
- Other drivers. Warming effects follow IPCC AR6. Methane and other gases decline slowly on the net-zero paths; the cooling effect of aerosols fades as coal and oil burning falls.
- Feedbacks. Ocean and land sinks weaken as warming and cumulative uptake rise, and recover as they fall; the low case uses half-strength and the high case double-strength sink weakening. With CDR, removal is adjusted each year to hold about 290 ppm against rebound and feedbacks.
Key insights
- Temperature lags CO2. With CDR, CO2 peaks around 2043 but temperature peaks about 9 years later, because the oceans keep releasing stored heat.
- Aerosol unmasking. As fossil-fuel burning falls, its cooling haze disappears. That briefly makes the net-zero path slightly warmer than flat emissions, by up to about 0.1 °C, from the early 2030s until about 2058, and it is why even aggressive removal cannot avoid passing 1.5 °C.
- Feedbacks matter most at the high end. Weakening sinks combined with high climate sensitivity push net-zero-only warming to about 2.7 °C in the high case.
- CDR’s climate payoff. Removal makes 2080 about 1.0 °C cooler than net zero alone (range 0.8–1.2 °C), and about 1.3 °C cooler by 2100.
Key insights
- Ice-sheet collapse, abrupt permafrost thaw and an Atlantic circulation (AMOC) shutdown are not modeled; their timing is too uncertain to put on a curve.
- Sea level keeps rising for centuries even after temperatures fall, because ice sheets and the deep ocean respond slowly.
5. Economic effects
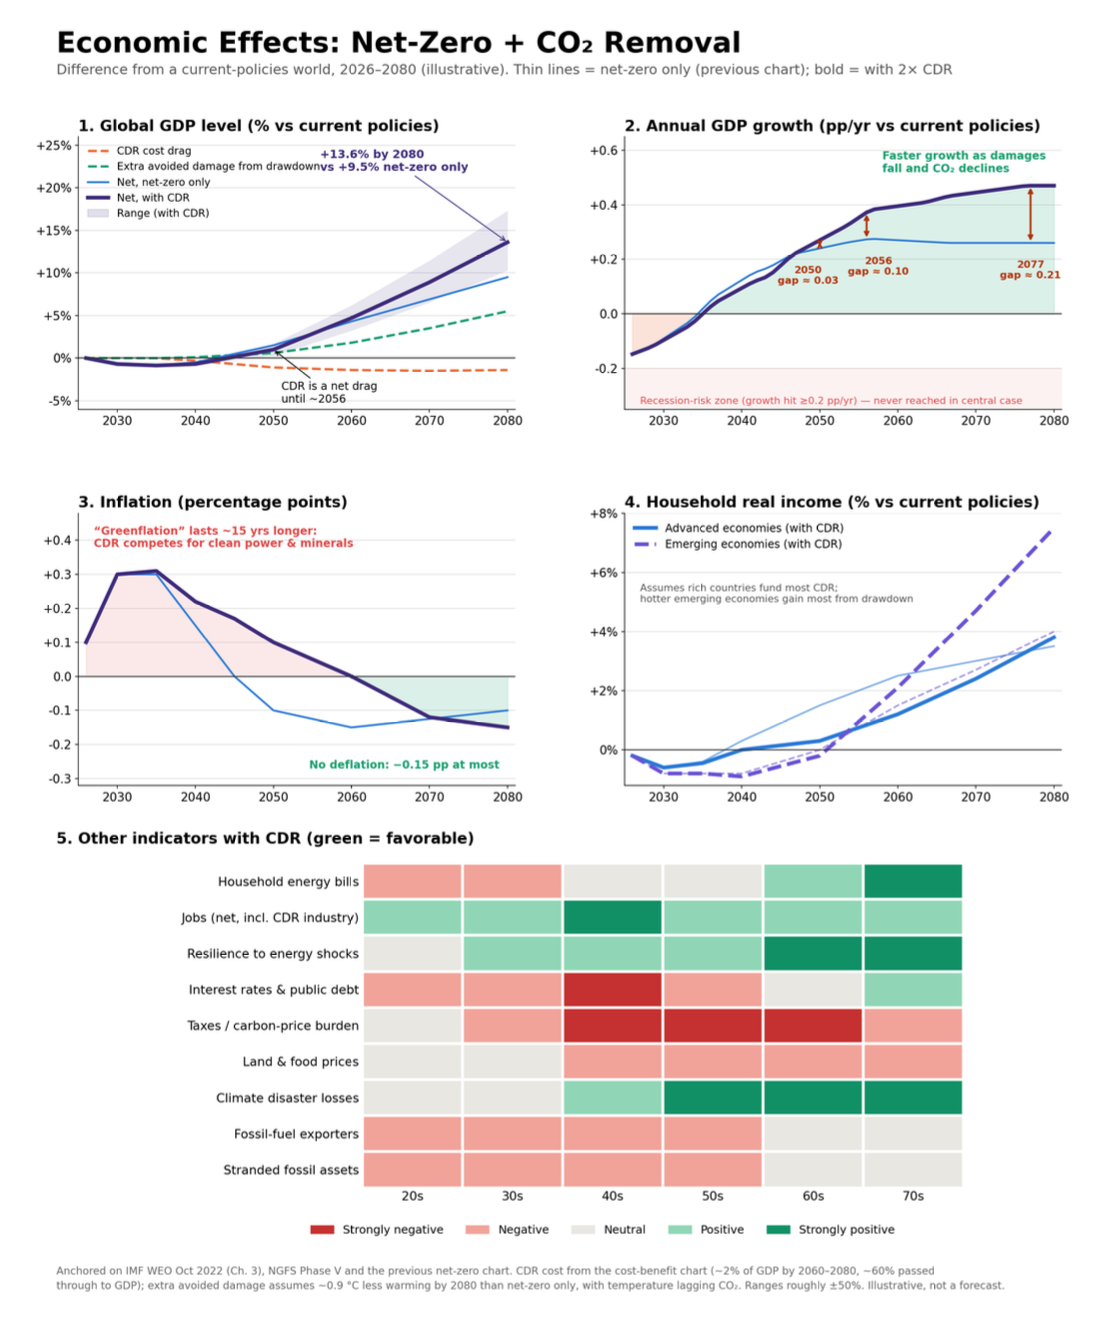
As before, every line shows the difference from a current-policies world. Thin lines repeat the net-zero-only results; bold lines add CDR.
Reading the panels
- GDP level (panel 1). CDR is a net drag of about 0.5% around 2050, then pulls ahead around 2056 as reduced warming pays off. By 2080 GDP is about 13.6% above current policies, versus 9.5% for net zero alone.
- GDP growth (panel 2). The deepest dip is about –0.15 points a year in the late 2020s, from the transition rather than removal, and never reaches recession territory. The red arrows mark the extra growth from CDR: about 0.03 points in 2050, 0.10 in 2056 and 0.21 by 2077.
- Inflation (panel 3). CDR competes for clean power, minerals and land, extending mild greenflation from the mid-2040s to about 2060. It peaks near +0.3 points; there is no deflation.
- Household income (panel 4). Assuming rich countries fund most removal, advanced-economy households lose about 1 point of income in the 2040s–60s. Emerging economies gain most, about +7.5% by 2080, because they suffer most from heat and can host removal industries.
- Other indicators (panel 5). Taxes, public debt and land and food prices worsen in the 2040s–60s; jobs, disaster losses and resilience improve. Fossil-fuel exporters are hit less hard because their geology and skills can be reused for CO storage.
Caveats
- Extra avoided damage in Figure 5 assumes about 0.9 °C less warming by 2080 than net zero alone. The coupled model in Figure 4 computes about 1.0 °C (range 0.8–1.2 °C), so the economic results are consistent and, if anything, slightly conservative. If damages per degree prove smaller, the crossover moves into the 2060s.
- Energy is the binding constraint. Removing 85 Gt a year could require a large share of all the energy the world uses today.
Bottom line
Returning to 350 ppm this century is physically possible, but only with a removal industry as large as the entire energy transition, built in parallel with it. Even then, warming would still overshoot 1.5 °C for about 45 years, from around 2029 until it falls back below around 2074. It is far beyond any IPCC pathway, which tops out at about 5–15 Gt a year, so this scenario is best read as a hypothetical upper bound: what it would take, not what is likely. It makes economic sense only when avoided climate damage is counted, and it cannot be financed the way clean energy can, because no one’s fuel bill falls.
Sources
Global Carbon Project, Global Carbon Budget 2025. Scripps Institution of Oceanography and NOAA Global MonitoringLaboratory, Mauna Loa CO record. Joos, F. et al., CO impulse response functions, Atmos. Chem. Phys. (2013). Millar, R. et 22al., FaIR simple climate model, Atmos. Chem. Phys. (2017). IPCC AR6 Working Group I (2021), Chapter 5, carbon-cycleresponse to CO removal. IPCC AR6 Working Group I (2021), effective radiative forcing and climate sensitivity. Forster, P. et 2al., Indicators of Global Climate Change, Earth Syst. Sci. Data. Held, I. et al. and Geoffroy, O. et al., two-layer energy-balance models, J. Climate (2010, 2013). IPCC AR6 Working Group III (2022), CDR pathways. US EPA, Report on the Social Cost of Greenhouse Gases (2023). International Monetary Fund, World Economic Outlook, October 2022, Chapter 3. NGFS Climate Scenarios Phase V (2024). IEA, World Energy Investment 2026. McKinsey Global Institute, The Net-Zero Transition (2022). Companion briefing: The Road to Net Zero (October 2026). All projections are illustrative models built from these sources, not forecasts.


